Draft for comment. This edition is open to everyone for comment while it is completed. Annual results are still being prepared, so please don't cite it until the edition is published.

First edition in development

The State of Urban Cycling Infrastructure

A world built for cycling?

This report measures three things in 750 urban areas: how much cycling infrastructure exists and of what kind, whether it joins up into a network, and how many people live close to it. It says plainly where open map data cannot answer.

Open data. Visible methods. Evidence for better-connected cities.

The global study
750 selected areas
Selected urban area

Loading the study map…

750 selected urban areas

Select a point to explore
GHSL

Source-defined urban areas, across 190 country and territory labels.
Understand the study boundaries

Study coverage shown. Annual scores are still being prepared.
750 selected urban areas
190 country and territory labels
9 regional study groups
247 areas below 250,000 residents

From the founder

Why the connections matter

Nobody rides a project. People ride from a front door to a school, a shop, a station or a job. A new cycle lane can improve part of that journey while leaving a difficult crossing or a missing connection unresolved. Counting kilometres tells us something important about what a city has provided. Understanding how those kilometres fit together tells us more.

Researchers, city authorities and cycling organisations have long recognised this. Established approaches provide important foundations, including PeopleForBikes’ Bicycle Network Analysis, which measures how well low-stress routes connect people to the places they need to reach, and ITDP’s measure of how many people live near protected cycling infrastructure. This report builds on that work. We want to make evidence about infrastructure useful across a varied set of urban areas, and make its limitations visible enough to challenge.

For this first edition, we have selected 750 urban areas for analysis. Almost one in three has fewer than 250,000 residents, and more than a third are in Asia. This is a deliberately selected benchmark, rather than a statistically representative sample of the world’s cities. It brings places of different sizes and circumstances into a shared investigation.

I want Asia to help shape how we understand that evidence. Its cities encompass many different street patterns, transport systems and cycling traditions. Research and practical experience from across the region should inform how we read the results, the definitions we refine and the explanations we offer. Any changes arising from that input will be recorded in the analysis plan. A global comparison has to be willing to learn from the places it measures.

That responsibility begins with examining our own assumptions. Our headline index credits a quiet street only where it is mapped as a cycle route, and its access measure counts only the lowest-stress routes: those away from motor traffic, and mapped cycle routes on calm streets. An ordinary calm street with no such mapping receives no scored credit, even where it may support everyday cycling. The importance of that omission needs to be tested locally. High cycling participation cannot establish that conditions work well for everyone; equally, an infrastructure score cannot describe the whole relationship between a city and the people who cycle in it.

The first edition examines three aspects of provision: the amount and type of qualifying infrastructure, the share of the low-stress network in its largest connected piece, and how many residents live near the lowest-stress routes. These measures can reveal patterns worth investigating. They cannot establish that every crossing is comfortable or every destination reachable. Our access measure counts residents within 300 metres as the crow flies, which can overlook barriers between a home and a route.

We use open data, including OpenStreetMap, the Global Human Settlement Layer and WorldPop. These sources make broad comparisons possible, but their coverage and detail vary. A sparse map may reflect missing records as well as missing infrastructure. We disclose those limitations and withhold the headline score when a required measure cannot be calculated.

We have published our research questions and analysis plan before the results. Version 1, dated 5 November 2026, records the questions this edition sets out to test. Alongside the results, we will publish the data versions, definitions and checks behind each finding. We will explain changes to the analysis and distinguish what we observed from what we think might explain it. Surprising results deserve closer examination, including scrutiny of the measure itself.

The purpose is to help people responsible for streets ask sharper questions. Which parts of a network remain disconnected? Which neighbourhoods warrant closer attention? Where does the map need correcting, and where does the method need improving?

I particularly welcome scrutiny from researchers, practitioners and cycling organisations across Asia, and from anyone whose knowledge of a place challenges our interpretation. A useful index should make those conversations better informed.

Anthony Joseph Founder and Chief Technology Officer, Party Onbici
No comments on this section yet.

The research questions

Five questions this edition will answer.

These questions were recorded before the annual cohort results were produced. For each, we state what we will measure, what we expect to find and what would show that we were wrong. Findings will be added here once the edition is validated.

  1. Provision

    How much cycling infrastructure do urban areas have, and of what kind?

    A kilometre of paint and a kilometre of kerb-protected track serve different people. A single total hides that difference.

    What we will measure
    Kilometres of each kind of infrastructure per square kilometre of built-up area, and the share that is separated from motor traffic.
    What we expect
    Large differences in quantity, and larger ones in kind: places with similar totals but very different shares of protected infrastructure.
    What would prove us wrong
    Totals and protected shares that rise and fall together, so that quantity alone tells the story.
  2. Connectivity

    Does nearby infrastructure form a connected network?

    A trip is only as good as its weakest link. Disconnected sections add length to a total without adding usable routes.

    What we will measure
    The share of each area’s low-stress network in its largest connected piece, and the number and size of the sections cut off from it.
    What we expect
    Many areas with substantial networks will be fragmented, with much of their infrastructure in sections that do not reach the rest.
    What would prove us wrong
    Areas with more infrastructure turning out, consistently, to be the better-connected ones.
  3. Access

    How many people live near infrastructure, and does it connect to anything?

    Proximity is the most quoted access measure. If it counts people who live close only to a dead end, it overstates access.

    What we will measure
    The share of residents within 300 metres of a route away from motor traffic, and how many of them are near only an isolated section.
    What we expect
    A noticeable share of the residents counted as living near infrastructure will be near sections that do not join the main network.
    What would prove us wrong
    Almost everyone who lives near infrastructure turning out to live near the connected network.

    Clarification, 6 November 2026. In the annual measure, a route away from motor traffic means the lowest level of traffic stress, which also includes mapped cycle routes on living, pedestrian and recorded quiet streets. See Amendment 1 to the analysis plan.

  4. Distribution

    Is provision shared fairly across neighbourhoods?

    An area-wide figure can describe a city that serves its centre well and its edges poorly as average.

    What we will measure
    How proximity and network density change between the centre of each urban area and its outer neighbourhoods, using population grids rather than averages.
    What we expect
    Provision concentrated in central areas, with outer neighbourhoods, where many residents live, served less well.
    What would prove us wrong
    Outer neighbourhoods served about as well as central ones in most areas.

    Clarification, 6 November 2026. The planned comparison of central and outer neighbourhoods measures geographic distribution. It does not establish whether provision is equitable by income, age, gender or disability.

  5. Smaller places

    Do smaller urban areas follow the same patterns as large ones?

    247 of the 750 areas have fewer than 250,000 residents. What works in them is rarely studied, and the lessons may travel further than those from the largest cities.

    What we will measure
    Every measure above, compared across population bands, with each area set beside peers of similar size, density and region.
    What we expect
    Smaller places will vary more widely than large ones, and some will compare well with much larger cities.
    What would prove us wrong
    Size explaining most of the variation, so that small places look like scaled-down large ones.
Analysis in progress. No finding is shown until the edition has been validated and frozen.

Executive summary: not yet written. Once the edition is validated, this is where a short answer to each of the five questions will appear, each with the number of eligible areas behind it. No answer is drafted in advance.

A question we ask of our own data

How complete is the open map?

Before any comparison, we check how well OpenStreetMap records infrastructure in each area: how much of it is classified, how recently it was mapped and, where councils publish their own inventories, how closely the two agree. An area where the map is too thin to support a result is reported as such, not scored.

What this edition will not answer

  • Whether people can reach everyday destinations by bike. That needs routed trips to schools, shops, jobs and stations. Distance to the nearest route cannot answer it. It is planned for a later edition.
  • How many people cycle, or how safe it feels. The provision of infrastructure is not the same as its use or as the experience of riding on it.
  • Why one place differs from another. Terrain, climate, urban form and governance may help explain differences. We show them as context and do not treat them as causes without evidence.
1 2 3 4

Questions 2 and 3, in one picture

Near is not the same as connected.

  1. The largest connected network.
  2. An isolated section: counted in the total, but it joins nothing.
  3. A short gap. Closing it would join a whole section to the network.
  4. Homes within 300 m of a route. Proximity counts them all, though the route near them reaches only part of the city.

Schematic illustration, not a real place.

No comments on this section yet.

The study footprint

A wider view of urban cycling.

Major metropolitan areas and smaller urban centres. Established networks and places still building them. A deliberately broad benchmark, with its limits made clear.

Almost 1 in 3

selected areas has fewer than 250,000 residents.

247 of the 750 areas bring smaller urban places into the picture. Population refers to the source’s 2025 urban-centre estimate.

Find a place in the study

Explore by region

Selected areas
Selected
750urban areas in the study register
Processed
—Not yet reported
Eligible for comparison
—Not yet determined
Withheld
—Not yet determined

A dash means not yet counted, never zero. The counts will be published from the completed annual run, with the reason each area was withheld: insufficient evidence, or a failed check. Results for municipal scorecards, such as the City of Sydney example below, are not annual-cohort progress.

From 52,000 residents to 43 million.

Each dot is one selected urban area, placed by its 2025 source population on a logarithmic scale. The dark mark is each region’s median; the dashed line is 250,000 residents.

Show the figures as a table
Selected urban areas by study region: smallest, median and largest 2025 source population.
Study region Selected areas Smallest Median Largest Below 250,000
Europe14558,333450,58114,384,08247
Sub-Saharan Africa10092,641732,30512,945,68330
Northern Africa and Western Asia7585,787843,58125,230,32524
Central and Southern Asia11076,648876,53837,307,16035
Eastern and South-Eastern Asia15077,224854,52242,987,70446
Latin America and the Caribbean9058,101846,07619,485,15830
Northern America5078,089908,95614,197,65915
Australia and New Zealand2055,458192,5824,375,39411
Other Oceania1051,991121,028442,1659
Measured

A check on our own selection

This chart showed us something we had not intended. Within the two smallest size bands, the allocation favoured the largest areas: of the 247 areas below 250,000 residents, 147 sit just under a band ceiling, at 90,000 to 99,999 or 230,000 to 249,999 residents. Results for smaller places will therefore describe the upper end of each band, and the report will say so wherever it compares them.

Areas shown: 750. Source: European Commission, Joint Research Centre, GHS-UCDB R2024A V1.2, 2025 population estimates. Selection: Party Onbici, 4 November 2026.

Two in three selected areas are in low- and middle-income countries.

Selected urban areas by the income group of their country, as recorded in the GHSL source.

  • 246 High income
  • 210 Upper-middle income
  • 224 Lower-middle income
  • 65 Low income
  • 5 Not classified in the source

Areas shown: 750. Source: GHS-UCDB R2024A V1.2 income-group attribute. A global benchmark that leaves out most of the world’s urban population cannot say much about how cities build for cycling.

Selection: Party Onbici, 4 November 2026. Geography and population: European Commission, Joint Research Centre, GHS-UCDB R2024A V1.2. This is a purposive benchmark; it is not a statistically representative sample of all cities worldwide.

No comments on this section yet.

Why boundaries matter

Same name. Different place.

A result describes the area it was measured on. Sydney shows how far two reasonable definitions of one city can differ.

Local government area

City of Sydney

Area
27 km²
Residents
about 228,000

The council area: the central city and its inner suburbs. This is the boundary of the public scorecard shown below.

GHSL urban centre 2324

Sydney urban centre

Area
1,378 km²
Residents
4,375,394

The continuous built-up area defined by the Global Human Settlement Layer. This is the footprint the annual edition will measure.

The urban centre covers about 50 times the area of the council and holds about 19 times the residents. A score measured on one cannot stand in for the other. That is why every result in this report names its boundary, its source identifier and the boundary version.

City of Sydney: public scorecard, geoBoundaries footprint, WorldPop population density, 5 November 2026. Sydney urban centre: GHS-UCDB R2024A V1.2, 2025 estimate. Squares are drawn to scale by area.

No comments on this section yet.

City explorer

Every place has a story. Start with yours.

Download the selected areas

Loading selected areas…

Selected GHSL urban areas. Population is the 2025 source estimate. Annual scores are not yet included in this preview.
Urban area Country or territory Population Annual score

The list shows the 750 selected source-defined areas, not 750 completed analyses. Annual scores will follow validation. The download is the full register, with each area’s selection reasons, source area and income group. Some urban areas encompass several cities; others form part of a wider metropolitan region.

No comments on this section yet.

Inside a city scorecard

The number is just the beginning.

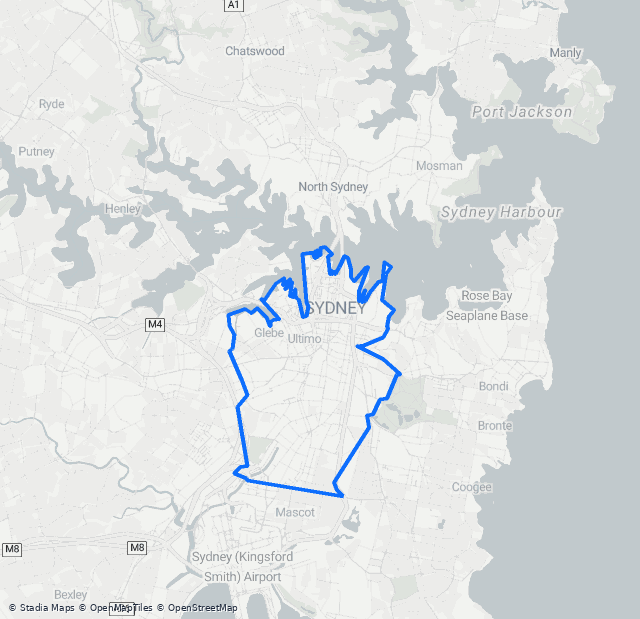
See the infrastructure, the study boundary and the evidence behind a score. City of Sydney illustrates the level of detail available in an individual profile.

Public scorecard locator map showing the City of Sydney municipal study boundary
Public scorecard example

City of Sydney

Australia · Municipal boundary

Map reproduced from the public city scorecard.
Boundary: geoBoundaries · © Stadia Maps · © OpenMapTiles · © OpenStreetMap contributors
Infrastructure Provision

Evidence you can explore.

85 / 100
Leading infrastructure Medium confidence
22 km

physically protected infrastructure

95 %

residents within 300 m of the lowest-stress routes

77 %

network in one connected piece

The raw measures behind it 123 km of cycling-accessible network modelled: 22 km physically protected, 78 km of shared path, 13 km painted and 11 km in mixed traffic. Study area 27 km², at about 8,400 residents per km².

Explore the full city scorecard (opens in new window)

Public scorecard captured 5 November 2026, methodology v19. This municipal example is separate from the annual GHSL cohort. Its figures are not a validated annual result.

Coverage

The public City of Sydney scorecard reports 123 km of modelled cycling-accessible network, including 22 km of physically protected infrastructure. Coverage accounts for the type and density of mapped facilities. This is a municipal scorecard example, not a result for the annual urban-area cohort.

83 / 100

Reported component values from the public scorecard. These are not four equally weighted contributions; the annual methodology and calculation checks will determine which measures enter the final comparison.

The city brief

What every city brief will contain.

Each of the 750 areas will have a brief built to the same plan, so that two places can be compared part by part rather than by one number.

  1. The study boundaryThe source, its identifier and the boundary version, with a map of the exact area measured.
  2. The headline and the raw measuresEach score beside the kilometres, residents and square kilometres it was calculated from.
  3. Confidence, and what lowers itHow much of the network is classified, how recently it was mapped and whether there is enough of it to measure.
  4. Peer contextAreas of similar size, density and region, never a different kind of boundary.
  5. ObservationsWhat the measures show, each labelled as a measured result or as an interpretation.
  6. Questions for the transport teamThe connections, neighbourhoods and records that deserve a closer look.

No comments on this section yet.

Supplementary context

What happens when you arrive?

Bicycle parking sits outside the headline infrastructure score. This section is context for reading a result, not a measure within it.

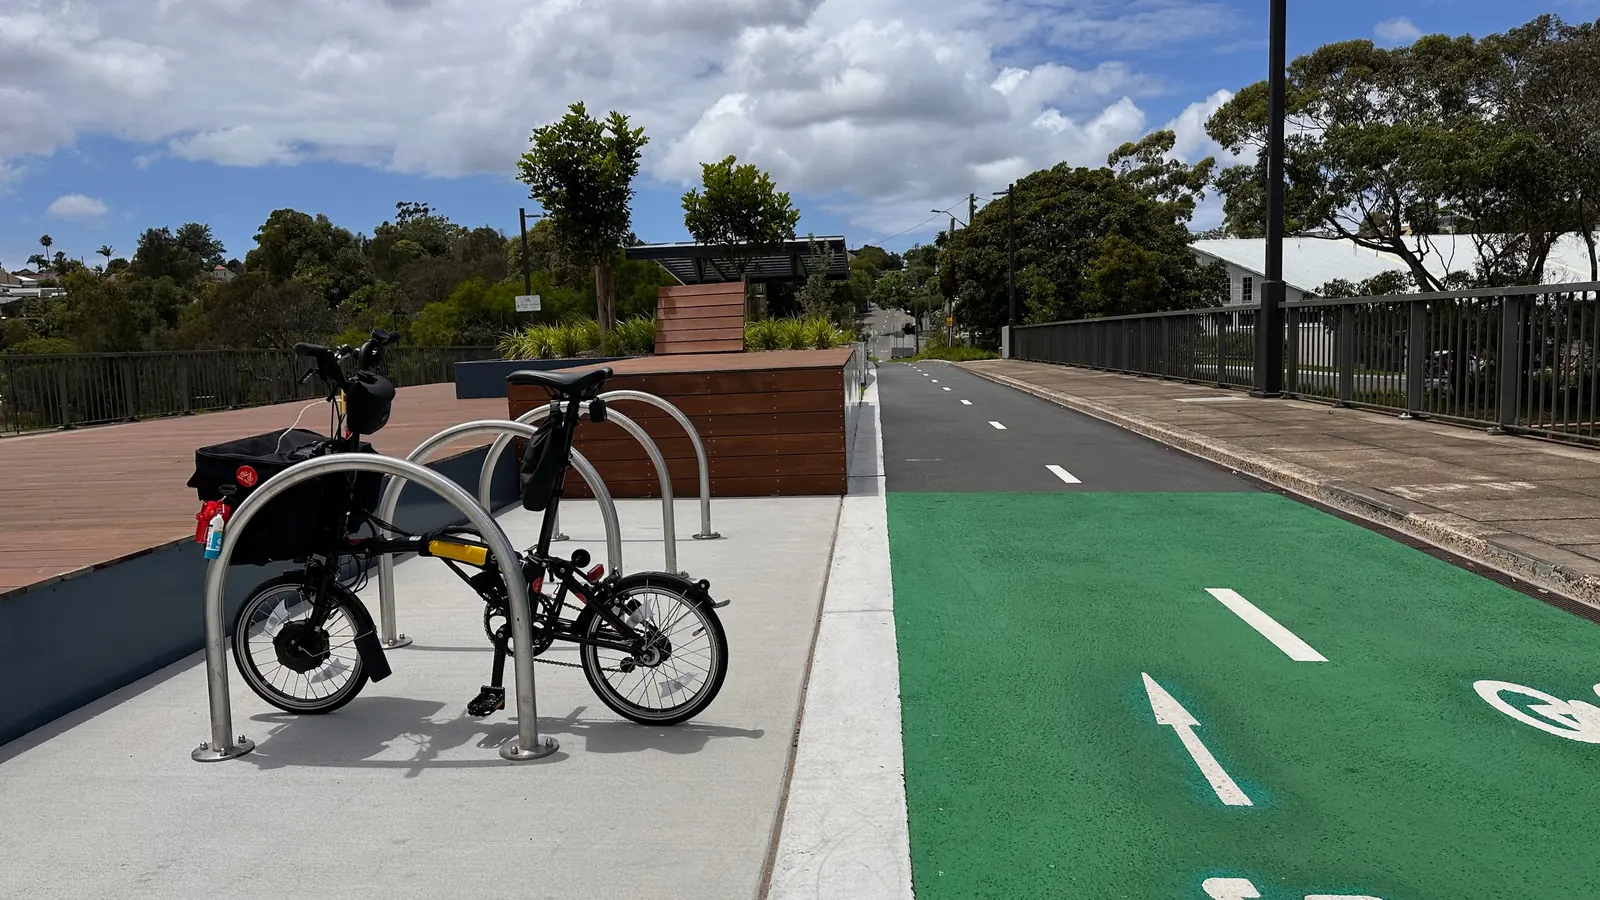
A folding bicycle parked between metal hoop racks beside a green-marked cycle route.
A folding bicycle parked at hoop racks beside a marked cycle route. Sydney, January 2024. Photography: Anthony Joseph

A cycling journey includes finding somewhere to leave the bicycle. A quick visit to a shop, a day at work and an overnight stay call for different parking arrangements. Location, capacity, security and ease of use deserve attention alongside the route itself.

Parking also connects the cycling network to everyday destinations. A route may bring someone close to a station, workplace or shop, while leaving unanswered questions about where they can park and whether the facilities suit their bicycle.

Open data provides a starting point. A mapped parking location does not establish how many usable spaces it contains, whether those spaces are occupied, or whether its design supports secure locking. Where recorded capacity is available, it should be reported separately from the number of mapped locations. Missing capacity information must remain visible.

We present bicycle parking as supplementary evidence, outside the headline infrastructure score. Understanding how provision works in practice requires local inventories, observation and the experience of people using it.

No parking figures appear in this preview, because the annual analysis has not yet been run. The amenity units used elsewhere in the index are weighted counts of facilities, not parking spaces.

How one funding program treats bike parking
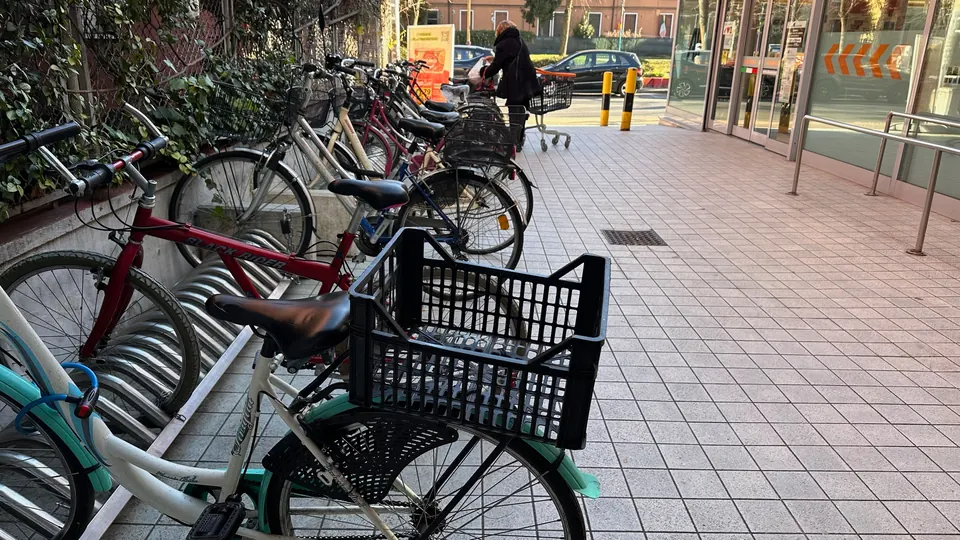
A row of bicycles with baskets and carriers parked beside a shop entrance.
Bicycles with baskets and carriers parked beside a shop entrance. Mainland Venice, January 2025. Photography: Anthony Joseph

Feature

Shared bikes, shared space

Shared bicycles offer access to cycling without owning or storing a bike. Their place in a city also depends on what happens when a journey ends.

A bicycle left across a footpath, kerb ramp or station entrance can obstruct someone else’s journey. Convenient parking therefore needs to be planned alongside clear pedestrian routes, sufficient capacity and reliable management.

The responsibilities extend beyond individual riders. Cities allocate space and set operating conditions. Operators deploy and redistribute their fleets and respond to obstructions. Riders need clear information and practical places to finish their journeys.

The allocation of street space deserves scrutiny too. Options include dedicated parking on the carriageway, changes to existing kerbside uses, and carefully located facilities near destinations. Decisions should consider pedestrian access, loading, public transport and accessible parking together.

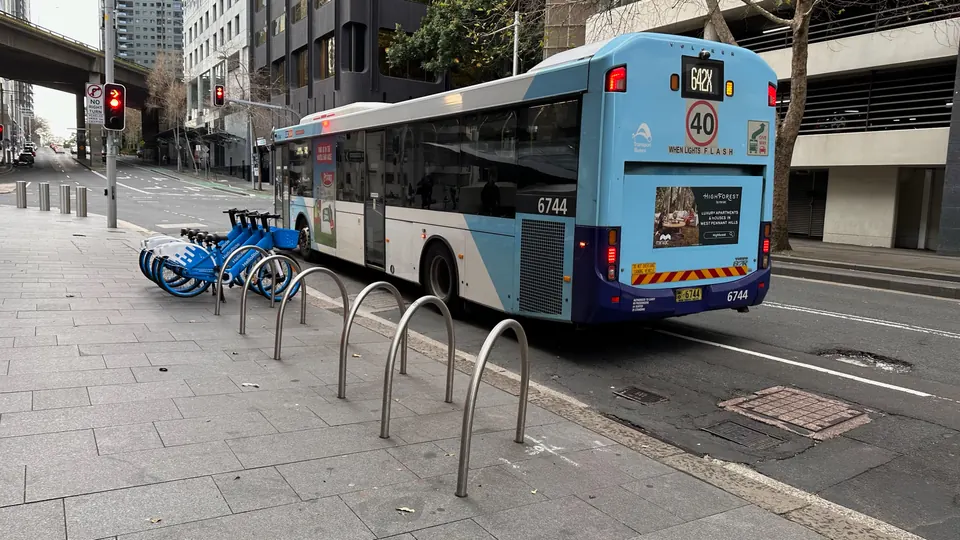
Blue shared bicycles beside a row of metal hoop racks, with a bus on the adjacent street.
Shared bicycles and hoop racks beside a city street, with a bus alongside. Sydney, July 2024. Photography: Anthony Joseph
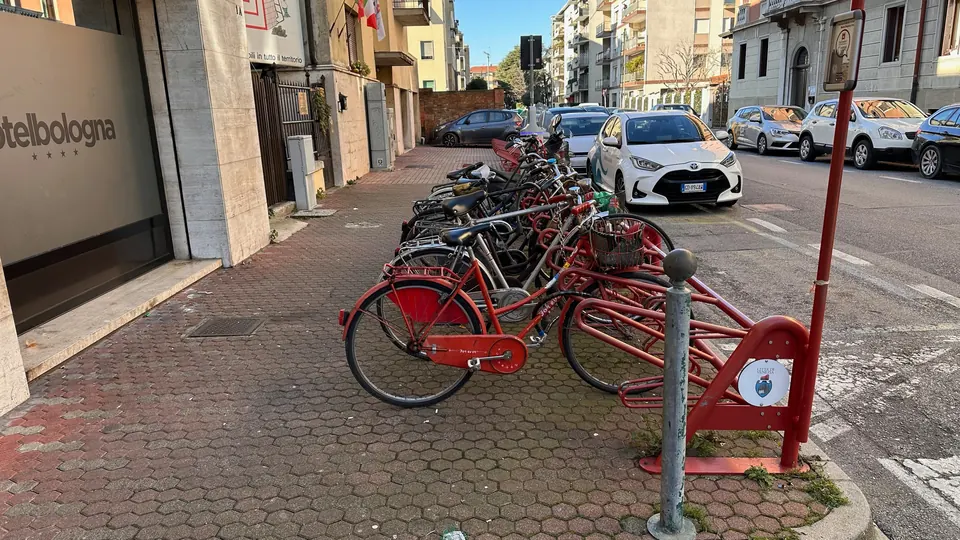
Bicycles parked at red racks along a pavement beside parked cars and a bus-stop sign.
Bicycles at a red parking rack beside parked cars, a bus-stop sign and building entrances. Mainland Venice, January 2025. Photography: Anthony Joseph

The photographs here illustrate different parking arrangements. They do not establish whether a location meets accessibility requirements, how frequently problems occur, or how well an operator manages its fleet.

How cities approach the problem

Singapore

Parliamentary reply, 27 February 2026

Singapore combines designated parking with operator accountability. In a February 2026 parliamentary response, its Ministry of Transport reported that 95% of shared-bicycle trips ended in designated parking areas during 2025. That figure describes where trips ended; it does not establish that every parking area remained unobstructed or had sufficient capacity.

Source: Ministry of Transport, Singapore (opens in new window)
Shanghai

Non-motor vehicle safety regulations, adopted 2021, amended May 2024

Shanghai’s regulations link shared-bicycle fleet numbers to available space, parking resources and travel demand. They also require redistribution and the removal of bicycles blocking passages. These provisions illustrate how parking supply and fleet management can be considered together; the regulations alone do not establish how consistently those requirements are met.

Source: Shanghai Municipal People’s Government (opens in new window)

Each example describes a policy or a reported figure at the date shown. Requirements set out in policy are not evidence that they are met in practice. The Singapore and Shanghai sources concern shared bicycles; TfL’s update covers dockless e-bikes and e-scooters together, and its parking measures are not specific to either.

No comments on this section yet.

Supplementary context — public investment

From public money to usable networks

What does public investment deliver, for whom, and how do we know? Like parking, this section sits outside the headline infrastructure score. It was added on 6 November 2026 and is not part of the original analysis plan.

Public investment shapes the routes people can use, but a budget announcement tells us only the beginning of the story. Funding may support a plan, a detailed design, a crossing or a completed path. Each represents a different stage towards a journey someone can make.

To understand what investment achieves, we need to follow it through delivery: what opened, which connections improved, who could use them, and what changed afterwards. A short crossing can complete an important route. A longer path can still leave a difficult gap.

Our infrastructure scores cannot establish the effects of spending on their own. They can help identify the network changes worth investigating and provide a baseline against which future delivery can be assessed.

  1. 1Funding committedBudget papers and program announcements
  2. 2Grants awardedGrant registers and funding agreements
  3. 3Money spentExpenditure and acquittal reports
  4. 4Infrastructure openedCompletion and opening records
  5. 5Network changeThe network mapped before and after
  6. 6Travel and safety outcomesCounts, surveys and crash records, with comparison sites
From funding to outcomes, in six stages: funding committed, grants awarded, money spent, infrastructure opened, network change, and travel and safety outcomes. Each stage needs its own evidence. A budget figure, a kilometre opened and a change in how people travel are different kinds of fact, and none of them can stand in for another.

Two Australian programs, as published

Both programs fund walking as well as riding, so neither total is cycling spending. The figures below are commitments and allocations: they describe money made available, not money spent or infrastructure delivered.

Two Australian active transport funding programs: amount, period, eligible work and funding stage.
Program Amount Period Eligible work Funding stage
Get NSW Active, NSW Government $60 million: $50 million general, $10 million Get Kids Active [1] One round, FY2026/27 [2] Walking and riding projects; Get Kids Active funds council infrastructure for children’s trips [1] Allocation; 79 projects awarded, August 2026 [3]
Active Transport Fund, Australian Government $50 million a year, after a $100 million first round [4] Ongoing from 2026–27 [5] Bicycle and walking paths; up to $5 million a project, with a co-contribution [5] Commitment; first round funded more than 80 projects, not a count of completions [4]
  1. Transport for NSW, program FAQs, November 2025, pp. 3–5 (PDF) (opens in new window)
  2. Transport for NSW, grant guidelines, November 2025, sections 2 and 3.1 (PDF) (opens in new window)
  3. Transport for NSW, Get NSW Active program page, reviewed 3 September 2026 (opens in new window)
  4. Minister for Infrastructure, media release, 3 August 2026 (opens in new window)
  5. Department of Infrastructure, Active Transport Fund program page (opens in new window)

Get Kids Active’s $10 million includes $500,000 for Active Routes to School. It funds infrastructure, not sports participation vouchers. All amounts are Australian dollars, and none is expenditure or completed works.

Reported delivery

Transport for NSW’s annual report for 2024–25 records 24 km of cycleways or shared paths and 41.9 km of pedestrian pathways opened to the public through Get NSW Active during that year. These are the agency’s reported outputs for 2024–25, from earlier rounds; they are not results of the 2026/27 allocation. The same page counts 101 projects that “opened to traffic or reached major design milestone”, which is not a count of completed construction.

Source: Transport for NSW Annual Report 2024–25, Volume 1, p. 29 (PDF) (opens in new window)

Elsewhere: six ways public money reaches cycling

These examples show different routes for public money: trying something new, paying for a whole journey, keeping routes in repair, making streets accessible, building cycling into public transport and preparing projects before construction. They are in different currencies and cover different scopes, periods and kinds of support, so they are not comparable and are not ranked.

Experimentation

European Union: RAPTOR, EIT Urban Mobility

A fixed €60,000 lump sum for each selected small company to run a pilot with a city, within an indicative €900,000 call for up to 15 projects. Selected companies pay a mandatory €5,000 commercial-support fee and 5 per cent of any sale arranged through the programme, so the award is not an unrestricted €60,000. Fourteen cities were paired with companies for pilots from July to December 2026, including cycling navigation in Trento and school-route analysis in Berlin. No results had been published by the evidence cut-off.

EIT Urban Mobility, RAPTOR 2026 call manual, version 1, 16 January 2026, sections 4.1–4.2 (PDF) (opens in new window) European Institute of Innovation and Technology, selected pilots, 6 July 2026 (opens in new window)

The whole journey

Philippines: Active Transport Bike Share System and Safe Pathways Program

The 2026 national budget appropriates PHP105.376 million to the Department of Transportation for this program. The budget proposal described protected bike lanes and walkways, bike racks, end-of-trip facilities and making temporary lanes permanent. It is a national budget line delivered by the department, not an application round.

Department of Budget and Management, General Appropriations Act 2026, Department of Transportation, p. 345 (PDF) (opens in new window) Department of Budget and Management, National Expenditure Program 2026, Department of Transportation (PDF) (opens in new window)

Maintenance

Catalonia, Spain: Bicycle Action Programme 2026–2030

Approved by the Generalitat on 31 March 2026: €240.2 million planned over five years for 266.5 km of cycle routes for everyday trips, 428.1 km of cycle-touring routes, secure bicycle parking at 40 railway stations and €3.1 million to maintain cycle routes. It is a government investment programme, not a grant round.

Government of Catalonia, press release, 31 March 2026 (in Catalan) (opens in new window)

Accessibility

Singapore: Friendly Streets and commuter facilities

About S$1 billion in additional funding over the next decade, announced in March 2024. It pays for Friendly Streets, which make walking and cycling within neighbourhoods safer and more comfortable, and for facilities such as covered walkways from stations and lifts at overhead bridges. Most of it is not cycling spending.

Land Transport Authority, news release, 5 March 2024 (opens in new window)

Project preparation

Chile: a bankable bikeways program

A US$100,000 grant from the World Bank’s Global Facility to Decarbonize Transport, listed among its 2025 grantees, to design the institutional and financial structure of a bikeway program for the Santiago region. The facility’s calls go to World Bank teams, not businesses. The register gives no completion status.

World Bank, Global Facility to Decarbonize Transport, grantees (opens in new window)

Funding records as published. Each describes money committed, appropriated or awarded, not money spent or results achieved. Evidence cut-off: 6 November 2026.

The funding register

A wider record of public and private funding for walking and cycling, compiled by Party Onbici: national, regional and local programmes, development-bank projects and philanthropic support. It is a research register, not a list of grants open today. Amounts cannot be added up or compared: currencies, periods and funding bases differ, and a national fund and the local programme it pays for can both appear. Unknown amounts are left blank, not counted as zero.

Loading the funding register…

Active transport funding records: programme, country, funding level, status, amount, what it supports and sources. Records are in English, as compiled.
Program Funding level Status Amount What it supports Sources
Download the funding register

Records are published as compiled by Party Onbici and checked against their sources on 6 or 7 November 2026, and they appear in English. Each describes money committed, appropriated, awarded or offered, not money spent or results achieved. The register covers some regions far more than others, so the number of records says nothing about where funding is greatest. Check eligibility and dates with the funder before applying.

What each kind of evidence can establish

  1. Commitments and grant awardsShow what money was made available and for which projects. They do not show what was spent or built.
  2. Reported expenditure and completed worksShow what was spent and what opened, as reported by the agency. They do not show whether anyone travels differently.
  3. Before-and-after observationsShow what changed on a route. Without a comparison, they cannot separate the project from weather, events or a wider trend.
  4. Evaluations with comparison groupsCompare treated places with similar untreated ones, which is the strongest way to attribute a change to a project.
  5. Modelled benefitsEstimate what a change could be worth. They are only as good as their assumptions, which must be published with them.

In NSW, every successful construction grant must provide before-and-after usage counts, following the method set out in the project’s funding deed. The guidelines set a minimum number of counting hours, but no single follow-up period for every project. Federal grants report progress quarterly and close with a post-completion report and before-and-after photographs of the site. The department may contact recipients for up to two years after completion, and its guidelines say the program may be evaluated from time to time.

The research for this section did not locate a published, program-wide evaluation of the effects of either fund. That records what we found by the evidence cut-off; it is not a claim that no evaluation exists.

More riders counted on a new route does not by itself mean more cycling. Some will be people who used to ride on nearby streets and have switched routes. A higher count does not establish additional cycling, how many different people ride, or less car travel.

What research elsewhere has measured

These studies examine particular interventions in particular places. None evaluates the Australian programs above, and none gives a return per dollar that would apply elsewhere.

External evidence
London, segregated and non-segregated routes

Accident Analysis and Prevention, 2025

A study of London’s Cycle Superhighways compared road segments near the routes with similar segments further away, before and after each opened. On segregated routes cycling rose and collisions did not rise faster than the extra cycling would predict. On non-segregated routes, collisions rose by about 27 per cent more than predicted for the number of people cycling. The authors note that part of the rise in counts may be people switching routes.

Source: Anupriya et al., Imperial College London and LSE, 2025 (opens in new window)
External evidence
The Netherlands, cycle highways

Transportation Research Part A, 2024

Using the national travel survey from 2010 to 2021, this study compared commuting trips of 5 to 15 km before and after 15 cycle highways opened, against trips the highways did not affect. Where a trip could use more than 5 km of a new highway, the probability of cycling rose by about 8 to 12 percentage points. Shorter overlaps showed no robust effect.

Source: Macedo Filho et al., Utrecht University, 2024 (opens in new window)
External evidence
England, monitoring and evaluation guidance

Active Travel England, published 17 July 2025

Active Travel England asks councils to collect data before a scheme is built and at several points afterwards, and notes that it is valuable to collect it over one to three years because cycling can keep building up for at least two. It recommends comparison sites free of the scheme’s influence, recording confounding factors such as road closures and weather, and checking whether journeys have moved from parallel routes.

Source: Active Travel England, GOV.UK (opens in new window)

Funding the whole journey

Get NSW Active’s 2026/27 rules exclude projects that primarily deliver bike parking, such as storage cages, along with the maintenance or renewal of existing assets and standalone lighting. Bike parking can still be included as a supporting facility within a wider project, as can repair stands. The rule is about what a project is mainly for. It does not make parking ineligible in every project, and other programs and council budgets may fund it.

That raises a question about the whole journey described in What happens when you arrive?: taken together, do the funding arrangements in a place pay for the routes, the crossings, somewhere to park and the maintenance that keeps them usable?

Two documented projects

These are documented examples of funding and delivery, drawn from public records. Neither has been independently evaluated, and neither is presented as a success story.

Reported delivery
Ron Brown Way and the Pacific Highway, Pelican, Lake Macquarie
Funding
Australian Government Active Transport Fund, first round: $1,300,000. The rest comes from Lake Macquarie City Council and the NSW Government’s Get NSW Active program.
Total project cost
$2,601,481 in the federal register; “$2.6 million” according to the council.
Scope
A shared path joining the paths on either side of Soldiers Road to Naru Street via Lake Macquarie Airport, with intersection safety improvements at the Pacific Highway, Awabakal Avenue and Soldiers Road. The sources give different lengths: at least 460 m in the register, about 280 m in the February 2025 announcement, and 480 m in two stages according to the council.
Stage and opening
Stage One, from Naru Street to the airport, was open by 14 August 2026. Stage Two, a 300 m extension with the road intersection upgrades, was then in design, with no date given.
Baseline and follow-up
No usage counts published that we could find.
Not verified
The exact opening date of Stage One, when Stage Two and the intersection works will be delivered, and how many people use the path.
Source: Department of Infrastructure, Active Transport Fund Tranche 1 register (opens in new window) Source: Lake Macquarie City Council, news release, 14 August 2026 (opens in new window)
Reported delivery
Wentworth Avenue and Page Street, Pagewood, Bayside
Funding
NSW Government, Get NSW Active: $1.57 million to Bayside Council. The council does not say which funding round.
Total project cost
Not stated.
Scope
Widening sections of the existing shared path, upgrading the pedestrian and cyclist crossings and traffic signals at the intersection, and associated resurfacing and landscaping.
Stage and opening
Construction, scheduled to start in mid to late September 2026 and to finish by late December 2026, weather permitting. The council’s 2025 consultation page had given early to June 2026.
Baseline and follow-up
No usage counts published that we could find.
Not verified
Whether works have started or finished, the round that funded them, and the total cost.
Source: Bayside Council, project page (no date shown) (opens in new window) Source: Bayside Council, consultation page, 2025 (opens in new window)

Government contributions need to be counted once. The Lake Macquarie path draws on federal, state and council money, so adding up what each government reports would count the same project more than once. Council areas also differ from the GHSL urban areas used in this report: one council’s spending can fall partly inside a study area, partly outside it, or across several. Spending cannot simply be divided by a study area.

The investment register

An interim record of walking and cycling projects funded, in delivery, built or opened since the start of 2024, compiled by Party Onbici: 8,814 projects or phases in 203 countries and territories, each with its funding, milestones and any before-and-after evidence. It follows each project from award towards opening, so that a later edition can connect investment to network change.

Open or completed, in full or in part
1,627
In delivery or procurement
1,256
Funded or planned, or awaiting an update
5,897
Report a before-and-after measure
69

Only 69 of the 8,814 records report a before-and-after measure of use or safety. Most projects have not been evaluated in a way that can be compared, and that is the gap this register is meant to make visible.

Loading the investment register…

Active transport investment projects: project and place, stage, type, amount, opening and source. Records are in English, as compiled.
Project Stage Type Amount Opening Sources
Download the investment register

An interim research snapshot, checked on 7 November 2026, and not a census. Every country has had at least an initial search, but only 994 of 5,046 subdivisions have been searched in their own right, so a missing project is not evidence of missing investment and the number of records cannot rank countries. Amounts are budgets, contract prices, allocations or contributions, which overlap, so none is added up. Projects are not yet matched to the study areas, because their exact locations are still being collected. Records appear in English, as compiled.

Evidence cut-off: 6 November 2026. Every figure in this section is quoted from the source linked beside it, as published on that date. Funding figures are in Australian dollars and have not been adjusted. Photographs elsewhere in this report do not show funded projects.

No comments on this section yet.

Practical investigation

From evidence to action

How a candidate connection moves from the map to a proposal, and what each step can and cannot establish.

The index identifies patterns across urban areas. Decisions about individual streets require a closer look.

Our analysis also identifies candidate connections for local investigation. Their purpose is to help transport teams examine what the mapped network suggests, why a location may warrant attention, and what needs checking before a proposal can advance.

Automated screening checks the underlying records, mapped geometry and specified structural criteria. Passing those checks does not establish construction feasibility, safe junction design or the additional journeys a connection would enable.

Nearby residents and mapped destinations provide context. They are not measures of residents who would newly gain access or destinations that would become newly reachable. Modelled health, transport-cost and carbon benefits remain conditional on the assumptions behind each scenario.

For each featured example, we will distinguish automated findings, modelled scenarios and local observations. Corrections and reasons for revising or rejecting a candidate are part of the evidence.

How these measures relate to other research
  1. 1Mapped issue
  2. 2Automated screening
  3. 3Local investigation
  4. 4Revised proposal

How each reviewed case study will be set out

  1. What the map suggests.
  2. Why the location was selected for investigation.
  3. What the automated checks establish.
  4. What local review found.
  5. What remains uncertain.
  6. The next step and its dated review status.

Reviewed case studies are pending

Case studies will appear here once a candidate has been reviewed locally. Maps and explanations will come before any monetary figure. Benefit figures will be labelled as conditional scenarios with their assumptions available; their ranges are scenarios, not statistical confidence intervals; and benefits will not be added up across candidates.

No candidate has been reviewed locally yet. Each review will record what the map cannot show:

  • how a junction or crossing works in practice;
  • the surface, and whether it is maintained;
  • obstructions such as parked vehicles, bins or works;
  • conditions after dark;
  • heat and shade along the route;
  • whether people using adapted cycles, wheelchairs or prams can use it.

No comments on this section yet.

For transport teams

A pattern tells you where to look, not what to build.

Each pattern below calls for a different investigation. None of them is a project until it has been checked on the street and with the people who use it.

Patterns in the evidence, what they may mean, and what to investigate next.
If the evidence shows It may mean Investigate next
Plenty of infrastructure, little of it connected Fragmentation: sections that stop before they reach each other. A connection audit at the ends of each isolated section, followed by inspection on the street.
Many residents nearby, few near the main network People live close to dead ends rather than to a network. Which isolated sections serve the most residents, and what it would take to join each one.
Good provision in the centre, little at the edges An uneven distribution across neighbourhoods. A neighbourhood analysis of the underserved areas, and consultation with the people who live there.
A long network that is mostly paint Quantity without separation from motor traffic. Which painted corridors carry the most motor traffic and could attract the most new riders.
Low confidence The map may be incomplete, rather than the network. A comparison of the open map with the council’s own inventory, then updated records.

Questions to take into a meeting

  • Which of our sections stop short of each other, and what would it take to join them?
  • Which neighbourhoods have residents near only an isolated section?
  • Where does the open map disagree with our own records, and which is right?
  • Which peers of a similar size and density have a more connected network, and how did they get there?

Leads, not projects

Where a later edition shows missing links, they are analytical candidates. They have not been engineered, costed or approved, and the report labels them that way every time they appear.

From public money to usable networks

No comments on this section yet.

Editorial standards

How every finding will be written.

A reader should always be able to tell what we measured, what we think it means and what we do not yet know.

  1. What we measuredThe measure, the boundary and the number of areas behind it.
  2. What we foundThe result, in one plain sentence.
  3. Why it mattersWhat the result means for the people who ride, or would.
  4. What remains uncertainThe limits of the data and the method, stated next to the result.
  5. What cities could investigateThe next question a transport team could take up.

Five kinds of statement, always labelled

Measured
A result calculated from the data, shown with its denominator and the number of areas behind it.
Interpretation
Our reading of what a result means. It can be argued with, and we say so.
External evidence
Research by others, cited so that it can be checked.
Reported delivery
What an agency or council says it funded, built or opened, quoted from its own records and not independently checked.
Modelled scenario
An estimate of what could happen under stated assumptions. It is not an observation.
  • Every finding ends with one sentence a transport director could repeat accurately in a meeting.
  • Every chart is titled with what it shows, and keeps its date, geography, units, sample size and source when it is shared on its own.
  • Averages are shown beside the distribution behind them, so that one figure cannot hide the spread.
  • Maps that are compared share a scale, a legend and facility definitions, or say where they differ.
  • Where a result surprised us, we say so and explain how we checked it. Where a place does not fit a pattern, we show it and look at why.

City stories

Chosen for what they teach.

Case studies will include strong performers, but not only them: contrasting network patterns, different regions and sizes, and pairs of places with similar scores and very different networks, which show why the components matter more than the headline.

  1. Local context
  2. Measured observations
  3. An annotated map
  4. A local explanation, from people who know the place
  5. A practical lesson
  6. Questions still open

No comments on this section yet.

A transparent approach

A useful benchmark shows its working.

Comparable geography, documented measures and visible uncertainty. The report will make it possible to understand what was measured, and where the evidence runs out.

1

Define the place

Use the published urban-centre footprint. Keep municipal and metropolitan results clearly distinguished.

2

Trace the evidence

Record infrastructure, population, source dates and classification decisions for each study area.

3

Check comparability

Reconcile definitions, calculations and evidence quality before drawing comparisons.

4

Freeze the edition

Preserve the final dataset and methods together, so the annual report remains reproducible.

What counts as cycling infrastructure

Each mapped section is sorted into one kind, and each is also given a level of traffic stress from its recorded road type, speed limit and number of lanes. Coverage weights a kilometre by both: separation from motor traffic counts, and so does how calm the traffic is where a route shares the road. A route on a road with no recorded speed limit is never assumed to be calm. The one exception is living and pedestrian streets, which count as the lowest level of traffic stress from their street type alone.

Access counts residents within 300 metres, in a straight line, of the lowest level of traffic stress: protected tracks, shared paths, and mapped cycle routes on living or pedestrian streets or on quiet streets with a recorded limit of about 32 km/h (20 mph) or less. This adapts ITDP’s People Near Protected Bikelanes, which measures 300 metres along the walking network; it is not an identical implementation.

Protected track

Space for cycling separated from motor traffic by a kerb, barrier or verge.

Coverage weight: 1.0 · Counts for access

Shared path

A path away from the road, shared with people walking.

Coverage weight: 0.65 · Counts for access

Painted lane

A lane marked on the road surface, with no physical separation.

Coverage weight: 0.3 where the recorded limit is about 32 km/h or less, otherwise 0

Mixed traffic

A designated cycle route on a road shared with motor vehicles.

Coverage weight: 0.8 on a quiet street with a recorded limit of about 32 km/h or less, which also counts for access; 0.5 up to about 40 km/h with no more than two lanes; otherwise 0

Crossing

Where a route crosses a road. Mapped and checked for connections, but not counted as length.

Coverage weight: 0

Unclassified

Mapped as cycling infrastructure without enough detail to tell which kind.

Coverage weight: as for mixed traffic · Lowers confidence above half the network

Four states, never confused

Result
A validated measure, shown with its confidence.
No qualifying infrastructure recorded
The map was checked and records none of the kind measured. This describes the map, which may be incomplete.
Insufficient evidence
Too little mapped data, or too few residents, to support a result. Shown as a gap, never as a zero.
Analysis incomplete
Not yet processed or validated. It says nothing about the place.

What lowers confidence

Confidence starts from how many dimensions could be measured, then drops one level for each of these. Every drop is listed on the area’s brief.

  • Fewer than 10,000 residents, or less than 10 km of mapped infrastructure
  • Fewer than 50 mapped sections
  • More than half of the network unclassified
  • Map data more than 180 days old
  • No recorded speed limit on three-fifths or more of the mixed-traffic kilometres, where at least 10 km is mapped. This also caps confidence at low; a quarter or more caps it at medium.

How aggregate figures are calculated

Regional and global figures give two numbers, because they answer different questions: the median area, which describes a typical place, and the population-weighted share, which describes the typical resident. Each is shown with the number of eligible areas behind it. Neither is an estimate for every city in the world.

Four reasons a score can change between editions

  1. The street changed. Infrastructure was built or removed.
  2. The map changed. Contributors added or corrected records of infrastructure that already existed.
  3. The method changed. We changed a definition, a threshold or a weight.
  4. The baseline changed. A new population estimate or a revised study boundary changed who and what is counted.

Only the first is progress on the ground. Each edition is frozen with its data, methods and boundaries, and comparisons between editions will distinguish these four sources of change.

Methodology notes, 6 November 2026

How the measures behave

These notes describe the rules in the current index methodology (version 19), which the annual cohort is scored under. They document existing behaviour and change none of it. They were written after Version 1 of the analysis plan and are not part of it.

How the current methodology treats low stress, connections, confidence, withholding and ranking.
Topic Current rule
Low stress Each mapped cycle route is given a level of traffic stress from its tags. Protected tracks, shared paths and living or pedestrian streets are the lowest level whatever the speed. A route sharing a quiet street is the lowest level at a recorded limit of about 32 km/h or less, and the second level up to about 40 km/h with no more than two lanes. Painted lanes reach the second level only at about 32 km/h or less. Apart from living and pedestrian streets, roads with no recorded limit are never treated as calm. The connected network uses the two lowest levels; access uses the lowest only. Ordinary streets not mapped as cycle routes are described separately and are never scored.
Connections and junctions Two sections are treated as connected when their mapped lines come within 25 metres of each other in the map projection, about 15 to 20 metres on the ground at mid-latitudes. Crossings are kept so that a network is not cut at every road. The measure does not model junction design, turning movements, one-way rules or barriers, and it does not show whether destinations can be reached.
What lowers confidence Confidence starts from how many of the six dimensions could be measured. Ridership and safety are not yet measured anywhere, so the highest starting level in practice is medium. Each driver listed above lowers it by one level.
What withholds a measure Coverage, connectivity and access are withheld when more than half of an area’s mapped kilometres have never been assessed for traffic stress. Connectivity is also withheld when the low-stress network is shorter than half a kilometre per square kilometre of study area, between 3 and 10 km in all, or when the area is too large to cluster. The headline score is withheld whenever coverage, connectivity or access is.
What is eligible for ranking The annual run records each area as validated, insufficient evidence or failed. It is validated only when its result is current, measured on the exact source footprint with full boundary coverage, publishable, and has a population and a headline score. Version 1 admitted only validated results to comparisons. Under Amendment 2, a result must also pass the public city board’s ranking checks before it is compared or ranked.

Source: Party Onbici City Cycling Index methodology, version 19, as implemented on 6 November 2026.

Methodological items and their status

Recorded and decided 6 November 2026. None of these changes a score.

  1. Access wording: resolved. Version 1 and question 3 describe access as nearness to a route away from motor traffic, while the current rule also counts mapped cycle routes on living, pedestrian and recorded quiet streets. Amendment 1 to the analysis plan adopts the current rule for the annual edition and records why.
  2. Coverage weights: explained; sensitivity results pending. The numerical weights are Party Onbici’s methodological choices. Their order, from a protected track to a mapped route on a recorded quiet street, a shared path and a slow painted lane, is informed by design guidance from NACTO, CROW and Can-BICS. None of those publishes weights, and none has calibrated or endorsed ours. The shared-path value is a discount for conflict with people walking. The sensitivity tests in Version 1, which include alternative class weights, will be published with the results.
  3. Ranking eligibility: resolved. Amendment 2 to the analysis plan sets out the checks an annual result must pass before it is compared or ranked, and how they relate to the public city board.
  4. Missing speed limits: resolved. A road with no recorded speed limit is never treated as calm, except living and pedestrian streets, which reach the lowest level of traffic stress from their street type alone. The glossary and the notes above now say so.

Supplementary context

Different measures, different questions

Cycling research examines several related questions: what infrastructure exists, who lives near it, which destinations it connects, and how people experience the journey. Each requires different evidence.

This report draws on established approaches while defining a narrower set of measures for the selected urban areas. We explain those influences, document our adaptations and identify what remains unmeasured.

Supplementary analyses explore how results respond to particular assumptions. They are Party Onbici calculations, not official results from the organisations whose work informs them. Because they share underlying data—and sometimes the same calculated values—agreement between them does not provide independent validation.

Established approaches, what each examines, and how this report’s measures differ.
Approach What it examines How this report differs
ITDP Atlas (opens in new window) How many people live near protected cycling infrastructure, measured as 300 m along the walking network. Our access measure counts residents within 300 m, in a straight line, of the lowest-stress routes, which include mapped cycle routes on calm streets as well as infrastructure away from motor traffic. A straight line can overlook barriers between a home and a route.
PeopleForBikes BNA (opens in new window) Low-stress connections between where people live and everyday destinations. Our connectivity measure is the share of the low-stress network in its largest connected piece. It does not show whether a destination can be reached.
Bike Score (opens in new window) A broader composite of bike infrastructure, hills, destinations, road connectivity and bicycle commuting. Our headline measures infrastructure only. Hills, destinations and how many people cycle are outside it.
CROW (opens in new window) Design requirements for cycling networks: coherence, directness, safety and health, comfort and attractiveness. We do not assess design quality. Our coverage weights record one aspect of it: how far each kilometre is separated from, or calm beside, motor traffic.
Can-BICS (opens in new window) A classification of cycling infrastructure organised by evidence on comfort and safety. Our six kinds of infrastructure draw similar distinctions from OpenStreetMap records. They are not Can-BICS classes.
BikeDNA (opens in new window) The quality of bicycle infrastructure data and of the network it describes, including comparison with reference data. Our confidence rating reflects some of the same concerns, such as unclassified records, map age and network size, but it is not a BikeDNA assessment.
What does the infrastructure score measure?

It describes provision of cycling infrastructure using defined open-data measures. It does not by itself measure cycling participation, experienced safety or the impact of an investment. The annual edition will state the exact indicators, weights and eligibility rules used.

Why are these 750 urban areas included?

Each study region has a fixed quota, from 150 areas in Eastern and South-Eastern Asia to 10 in Oceania outside Australia and New Zealand. Areas qualified for one or more recorded reasons: being the largest urban centre in their country or territory (190 areas), a capital in the source (183), home to at least 5 million people (87), a place with an existing international profile (191), an earlier priority addition (50) or a named peer comparison (20). The remaining places were allocated by population band and country within each region (359). Every area’s reasons are in the downloadable register. It is an editorially selected benchmark, not a probability sample.

What happens when evidence is missing?

Missing evidence remains visible. It is not converted into a zero score, and difficult-to-measure places stay in the study register. Completed, validated, rank-eligible and unresolved results will be reported separately.

Can the report show year-on-year improvement?

This first edition establishes a baseline. Progress claims need comparable boundaries, methods and source dates. An update to a map does not, by itself, establish that new infrastructure has been built.

Read the current index methodology

No comments on this section yet.

Analysis plan

What we committed to before seeing the results.

Any change to this plan will be listed with its date and reason. A result that departs from it is labelled exploratory.

Version 1 Set on 5 November 2026, before any annual result was produced.

Questions
The five questions above, and the check of map completeness that comes before them.
Measures
Infrastructure of each kind per square kilometre of built-up area; the share of the low-stress network in its largest connected piece; the share of residents within 300 m of a route away from motor traffic and, of those, the share near only an isolated section; and the difference in proximity between central and outer neighbourhoods.
Comparison groups
Four population bands (50,000 to 99,999; 100,000 to 249,999; 250,000 to 999,999; 1 million or more), three density bands of equal size within the cohort, and nine study regions. Peers share a population band and a density band. Regional context is shown beside them, not mixed into them.
Known limits of the cohort
The smallest towns in each size band are thinly represented, because most selected areas sit just below a band ceiling. Every comparison by size reports this beside its result.
Eligibility
An area enters a comparison only when its result is validated: measured on its exact source footprint, with population from its own grid, and map data from within 92 days of 1 November 2026, or disclosed as outside that window. Areas below the evidence thresholds are reported, not ranked.
Aggregation
Medians across eligible areas and population-weighted shares, each with its count of eligible areas.
Checks before publication
  • A manual audit of a sample drawn from every region and size band, including high and low results, comparing the classified network with imagery and, where available, local inventories. The sample, the method and what it found will be published.
  • A review by hand of every area in the top and bottom tenth, and of every result that moves sharply under the tests below.
  • Sensitivity tests: access at 200 m and 500 m as well as 300 m, shared paths counted and not counted as traffic-free, and alternative class weights. A finding is called robust only if it holds under all of them.

Amendments to Version 1

Version 1 above is unchanged. Each amendment records what changes, why, and when it was decided.

  1. Amendment 1: what “away from motor traffic” means

    Version 1 and question 3 measure the share of residents near a route away from motor traffic. The annual cohort is scored under index methodology version 19, whose access measure counts the lowest level of traffic stress: protected tracks and shared paths, and mapped cycle routes on living or pedestrian streets or on quiet streets with a recorded limit of about 32 km/h or less. The annual access results use that definition.

    Reason: the plan’s wording was written before this rule was applied to the cohort, and a result must be described by the method that produced it. Question 3 is kept as it was recorded, with a clarification beside it.

  2. Amendment 2: what a result must pass before it is compared or ranked

    A result enters a comparison or a ranking only when it is validated, as Version 1 sets out, and also passes the checks the public city board applies before ranking a city: a headline score that could be calculated with no dimension withheld; a boundary measured on its own polygon, of an established and rankable type, with no plausibility or containment warning; population from the standard layer, with its source resolved and its provenance complete; source details recorded; and money figures in the area’s own currency. A validated result that fails any of these is reported, not ranked.

    Reason: the annual edition and the public board should not rank a place under different rules. Version 1 required validation only. The annual run already records these checks for each area; the comparison will now require them.

Editorial change log

Changes to the presentation of this draft. They are not changes to the analysis plan above.

  1. Expanded the funding register to 330 records covering 72 countries and international programmes, checked on 6 or 7 November 2026: 110 added, 9 restored and 4 updated, with the 211 earlier records kept. The register remains supplementary to the index and changes no score.
  2. Recorded two amendments to the analysis plan, leaving Version 1 unchanged: the definition of access used for the annual edition, and the checks a result must pass before it is compared or ranked. Added a clarification beside question 3 and brought the foreword, the Sydney access label and the comparison of measures into line with the first amendment. Stated the exception for living and pedestrian streets, explained the basis of the coverage weights and marked the methodological items with their status. Shortened the funding table and moved its sources to numbered references. Added six funding examples from outside Australia, each checked against its official source, to show different ways public money reaches cycling. Added a searchable register of 211 funding records in 64 countries, compiled by Party Onbici, with a download. Turned off automatic hyphenation in body text on wider screens. Corrected “the three” to “these four sources of change”.
  3. Added supplementary context: “From public money to usable networks”, on public investment, with Australian funding examples, reported delivery, two documented projects and research from elsewhere (evidence cut-off 6 November 2026), and an investment register as future work. Added places for the executive summary, cohort progress, validation findings and local review, each showing its current status. Clarified that the distribution question measures geography, not equity by income, age, gender or disability. Corrected the coverage figure to “Almost 1 in 3” and the note on when the questions were recorded. Added population and boundary revisions as a reason scores can change. Brought the glossary and confidence list into line with methodology version 19, under which the cohort is scored: the glossary had shown the earlier flat weights. Added dated methodology notes and four open items for the editor. Added two evidence labels: reported delivery and modelled scenario. None of this enters the headline score, and the five questions and Version 1 of the analysis plan are unchanged.
  4. Added supplementary context and interpretation: “What happens when you arrive?”, with the feature “Shared bikes, shared space”; “From evidence to action”; and “Different measures, different questions” in the methodology. The questions, measures, comparison groups, eligibility rules, scoring rules and weights of Version 1 are unchanged.

No comments on this section yet.

Review, independence and corrections

Open to challenge, by design.

Evidence that a result is wrong is the most useful thing a reader can send. Write to founders@partyonbici.com.

Review

This draft has had internal review only. Before publication, the methods will go through an external technical review, and the city interpretations through review by people who know those places. Reviewers will be named, with the specific work each one reviewed. The report will not call itself peer-reviewed unless it has been formally peer-reviewed.

Independence

Party Onbici offers paid services to cities and organisations. No one can pay to be included in the study, to be left out of it or to change a result, and clients see their results when everyone else does. Funding and commercial relationships connected to this edition will be listed here before publication.

Validation findings

The manual audit and the sensitivity tests in the analysis plan have not yet been run on the annual cohort. What they find, including every correction they lead to, will be summarised here before any result is published.

Corrections

Anyone can submit evidence that a result is wrong, including a council’s own inventory. Each submission is assessed against the published method and recorded in a public log with its date and outcome. A published edition is never changed silently: corrections appear as dated errata, and fixes to the open map reach the next edition.

No comments on this section yet.

The first annual edition

From global patterns to local decisions.

Each chapter answers one question, and ends with a sentence a reader can take into a meeting. The structure is ready to develop alongside the city analysis.

Party Onbici Annual research

The State of Urban Cycling Infrastructure

A global benchmark First edition, in development
Scope

What does the global picture show?

Coverage, the headline findings and what the benchmark can and cannot tell us.

Comparisons

Do similar places build similar networks?

Peer and regional comparisons, with the spread shown beside every average and evidence quality in view.

City stories

What do connected networks have in common?

Case studies chosen for what they teach, including places that do not fit the pattern.

Action

Where should transport teams look first?

Patterns matched to the investigations they call for, with open questions for each.

Open methods

How was each number produced?

Definitions, sources, the analysis plan, the audit and the full study register.

No comments on this section yet.

About this report

Who is behind it, and how to use it.

Authorship

Edited by Anthony Joseph, who leads Party Onbici’s research on cycling infrastructure, including the City Cycling Index. He is responsible for the report’s content and for any errors in it.

Contributors and reviewers will be credited by name and role as their work is completed.

How you can help

  • Researchers: challenge a method, a threshold or a weight.
  • Planners and engineers: explain why something that looks simple on a map is hard on the street.
  • Local organisations: tell us whether our reading of your place is right.

We are also forming a small advisory group, whose members will each carry out a defined review for every edition.

After the annual edition

A technical methods paper, written for researchers to scrutinise and cite, will accompany the edition. Focused briefings will follow on questions the data can answer, beginning with smaller urban areas and network fragmentation. Each briefing is new analysis; the annual edition itself stays frozen.

Citing and reusing the edition

This is a draft. Please do not cite it until the edition is published. Once it is, cite it as:

Joseph, A. (2026). The State of Urban Cycling Infrastructure 2026: A global benchmark of 750 urban areas. First edition. Party Onbici. https://www.partyonbici.com/annual-report/2026/

Derived data from OpenStreetMap is available under the Open Database License (ODbL). GHSL boundaries and population are © European Union, JRC, under CC BY 4.0. Reuse terms for the report itself, the data tables and the graphics will be published with the edition.

No comments on this section yet.

A publication in progress.

At release, the edition will be published as a two-minute overview, the full report and a technical appendix, with a brief for every city, data downloads and graphics that keep their sources. This page is a preview of its structure and coverage.

Selected urban area

Source population, 2025
Study region
GHSL source ID
Boundary version
GHS-UCDB R2024A V1.2 (2025)
Annual result not yet included in this preview

How the study works

Comment on this section

Shown with your comment.

Never shown. We only use it if we need to ask you about your comment.

Every comment is checked automatically and by our team before it appears, with your name. Your email and IP address are never shown; we keep them for 90 days to deal with abuse. Approved comments stay on the page until you ask us to remove them. Privacy Policy (opens in new window)