City of Sydney
A live, open-data readiness scorecard for cycling in your city — built from OpenStreetMap and WorldPop, assessed using a consistent global methodology, and refreshed as the map changes.
Overview
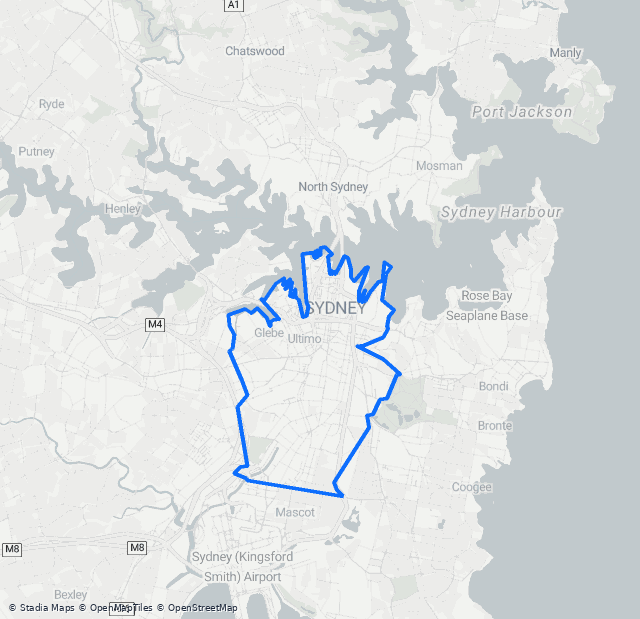 Scored on: Municipality.
City of Sydney
A live, open-data readiness scorecard for cycling in your city — built from OpenStreetMap and WorldPop, assessed using a consistent global methodology, and refreshed as the map changes.
Eight dimensions, four of them scored
The Infrastructure Provision score rests on open data alone. What our riders experience — ridership, safety and time lost at intersections — is measured separately, so the benchmark can never be flattered by who happens to use our app.
How confident is each part?
Municipality — The scored polygon IS one published administrative feature, cited by its own geoBoundaries shapeID, so its identity rests on that citation rather than on a measurement against a municipal-tier feature.
76% of network length carries an explicit separation tag · 24% was inferred from route and access attributes · 0% is unclassified.
Residents within 300 m of traffic-free infrastructure — an off-street path or a physically protected lane (ITDP's definition) — from WorldPop gridded population. Composition: the traffic-free network behind it is 22 km separated cycleway and 78 km path shared with pedestrians (78% shared). Capped at the confidence of its weakest essential input (Infrastructure classification).
Counts reliably represent amenities mapped in OpenStreetMap, but mapping completeness has not been independently validated for this city.
Largest-connected-component analysis of the low-stress network. 9 of 17 prioritised corridors are stored as multi-part geometries (up to 5 separate pieces), so they are not continuous on the ground and the corridor geometry on this page cannot be treated as validated.
A modelled scenario (conservative to ambitious uptake), not a measured outcome — see ROI assumptions.
Every city is scored the same way. Rankings follow.
City of Sydney's rank among the 385 comparably scored study areas in this assessment set
Scored on: Municipality.
The index is computed identically for every scored city, so your position against peers is a consistent comparative baseline. Compare against neighbours, cities your size, or the other study areas assessed alongside yours.
Scores for other cities update weekly as their maps change; a city needs a comparable dimension set to appear in a cohort.
-
23
City of Sydney This city
85
-
123
North Sydney (NSW)
50
-
144
Inner West (NSW)
45
-
171
Waverley (NSW)
40
-
183
Woollahra (NSW)
38
-
23
City of Sydney This city
85
-
198
Pickering (GHSL 3167)
37
-
200
Penrith (NSW)
36
-
259
Abu Dhabi
27
-
283
Cinco Ranch (GHSL 6114)
22
-
23
City of Sydney This city
85
-
27
Freiburg im Breisgau (GHSL 2756)
85
-
131
Neuquén (GHSL 2410)
49
-
185
Bern
38
-
277
Sarajevo (GHSL 426)
24
#2 of 21 rolling, dense municipal cores with 150,000–300,000 residents
-
1
Lund (GHSL 699)
99
-
2
Oulu (GHSL 269)
99
-
21
Aarhus
86
-
22
Odense (GHSL 410)
86
-
23
City of Sydney This city
85
-
24
Bruges (GHSL 403)
85
-
25
Aalborg (GHSL 72)
85
14 points behind Lund (GHSL 699) — the priority corridors below identify potential opportunities to strengthen the network.
City of Sydney seen through the world's cycling frameworks
Unofficial estimates computed from open data, inspired by ITDP, PeopleForBikes, CROW, Can-BICS and BikeDNA. Each lens abstains where the data can't support a reliable number — abstentions never lower the score.
101 separate low-stress islands; largest 97 km of 126 km. 99% of residents live near any low-stress route, 84% near the largest network.
2 of 4 components computable (infrastructure, destinations), shown as separate figures; hills and commute mode share excluded, and no composite is printed — a partial mean is not comparable to an official Bike Score
22 km high (separated) · 89 km medium (shared) · 13 km low (painted)
Physically protected infrastructure only — the strictest definition, the one a council's own inventory counts. A disclosure, never a scoring input: cycling on calm streets, or legal sidewalk riding in some countries, sits outside this model. 69% of residents live within 300 m of it.
2,307 mapped ways · 100% classified · OSM data 0 days old
Residents within 800 m of any cycle infrastructure — a generous upper bound
Benchmark lenses are unofficial estimates computed by Party Onbici from open data, inspired by the named frameworks. They are not official ITDP, PeopleForBikes, Bike Score, CROW or Can-BICS results.
Grey tiles and "not assessed" chips are deliberate abstentions, not errors: each lens declines to estimate where open data cannot support a reliable number. Abstentions never lower a city's scores.
Candidate areas requiring local validation
Automated screening shortlist for City of SydneyDrawn from OpenStreetMap and WorldPop via our ROI model, then put through an automated screen. Each shortlisted corridor closes a real gap in today's network and leads with its modelled annual benefit potential — indicative health benefit and running-cost savings; new-cyclist and CO₂ figures span a conservative to an ambitious uptake scenario. Passing the screen is not a recommendation to build.
1,470 candidate network discontinuities detected before screening · 203 consolidated corridor candidates created from them · 12 consolidated candidates cleared the automated screening gate city-wide · 20 are carried into this report, 7 of them passing
Estimates from OpenStreetMap & WorldPop via the Party Onbici ROI model — indicative figures for prioritisation, not a substitute for detailed design. Resident catchments are estimated from the population and network analysis; uptake, health, cost and carbon results are scenario estimates.
Figures are in AUD (2026 prices). Cross-city monetary comparisons are indicative only — each city is valued with its own jurisdiction-specific parameters, not converted to a common currency.
Economic parameters: AUS — National appraisal guidance.
What the automated screen checks
- Every constituent gap it states resolves to a real row
- One continuous piece of geometry on the ground
- A plausible set of distinct network edges behind it
- Calculated, member and drawn lengths reconcile
- Structural network-gain proxy passed
-
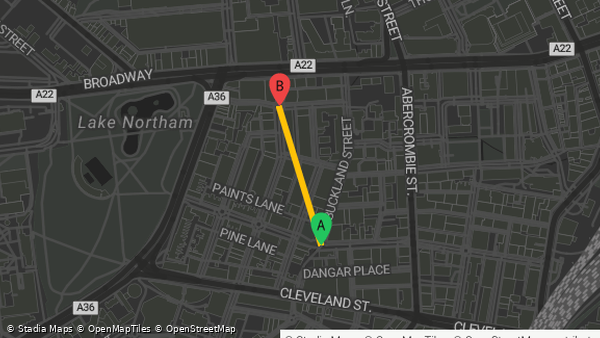 1 Missing link · 278 m
Pine Street
Locality: Pine Street
Location -33.88619, 151.19645
Corridor ID 282449e6-2939-46aa-9cc3-fb2415a1983f
✓ Automated screening: passed 5 of 5 checks.
Structural network-gain proxy: the distinct existing ways the build would join, the destinations ALREADY MAPPED inside its catchment (not destinations this build would newly connect), and a minimum build length. Routed before/after connectivity gain: not assessed. No routed connectivity model exists in this pipeline, so connectivity before, connectivity after and the residents who would newly gain access are reported as unavailable rather than estimated from the catchment.
This area ranks highly because approximately 36 school features, 7 transport features, 61 workplace features, 100 shop & service features, 113 other mapped features are already mapped within a 2 km cycling catchment of it, and it addresses a 278 m gap in the existing network. Estimated mapped destinations in the 2 km catchment: this corridor's category breakdown is reconciled across overlapping catchments, so the figures are approximate counts of mapped features rather than exact ones.
Residents in catchment14,339Health benefit / yearAUD 155,911 – AUD 937,646conservative–ambitious uptakeFuel & running-cost saving / yearAUD 6,371 – AUD 38,316conservative–ambitious uptakeModelled additional cyclists at sustained uptake143 – 860conservative–ambitious uptakeDestinations mapped in catchment317CO₂ saved / year7.0 t – 42.1 tconservative–ambitious uptake -
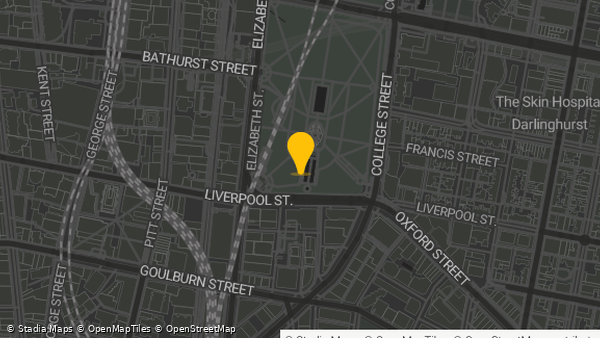 2 Bike lane
Liverpool Street
Locality: Liverpool Street
Location -33.87644, 151.21064
Corridor ID ed18c7cf-8aee-416a-882b-ff497bd3cea1
This area ranks highly because 74 school features, 51 transport features, 548 workplace features, 425 shop & service features are already mapped within a 2 km cycling catchment of it, and it addresses a 2.5 km gap in the existing network.
Residents in catchment13,121Health benefit / yearAUD 142,827 – AUD 858,055conservative–ambitious uptakeFuel & running-cost saving / yearAUD 5,837 – AUD 35,064conservative–ambitious uptakeModelled additional cyclists at sustained uptake131 – 787conservative–ambitious uptakeDestinations mapped in catchment1,415CO₂ saved / year6.4 t – 38.6 tconservative–ambitious uptake -
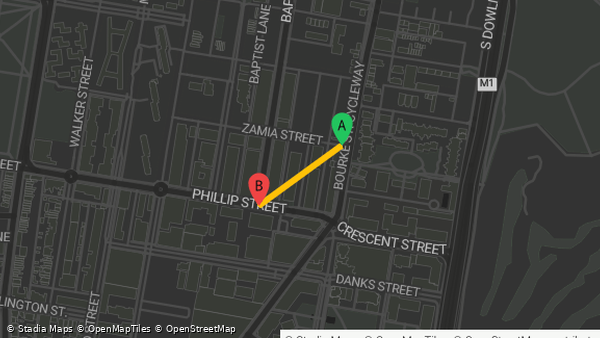 3 Missing link · 276 m
Kepos Street
Locality: Kepos Street
Location -33.89628, 151.21247
Corridor ID c7052733-2b98-4ca3-8707-4b224c54b88d
✓ Automated screening: passed 5 of 5 checks.
Structural network-gain proxy: the distinct existing ways the build would join, the destinations ALREADY MAPPED inside its catchment (not destinations this build would newly connect), and a minimum build length. Routed before/after connectivity gain: not assessed. No routed connectivity model exists in this pipeline, so connectivity before, connectivity after and the residents who would newly gain access are reported as unavailable rather than estimated from the catchment.
This area ranks highly because approximately 12 school features, 20 workplace features, 56 shop & service features, 86 other mapped features are already mapped within a 2 km cycling catchment of it, and it addresses a 276 m gap in the existing network. Estimated mapped destinations in the 2 km catchment: this corridor's category breakdown is reconciled across overlapping catchments, so the figures are approximate counts of mapped features rather than exact ones.
Its most exposed stretch would need about 9 more percentage points of tree canopy to stay usable in extreme heat.
Residents in catchment11,753Health benefit / yearAUD 128,654 – AUD 768,651conservative–ambitious uptakeFuel & running-cost saving / yearAUD 5,257 – AUD 31,410conservative–ambitious uptakeModelled additional cyclists at sustained uptake118 – 705conservative–ambitious uptakeDestinations mapped in catchment174CO₂ saved / year5.8 t – 34.6 tconservative–ambitious uptake -
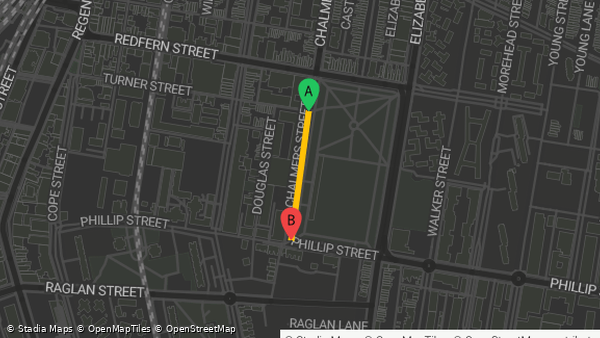 4 Missing link · 249 m
Chalmers Street
Locality: Chalmers Street
Location -33.89475, 151.20509
Corridor ID d7ae0d8a-888c-4ac8-994b-9a4b347a8d26
✓ Automated screening: passed 5 of 5 checks.
Structural network-gain proxy: the distinct existing ways the build would join, the destinations ALREADY MAPPED inside its catchment (not destinations this build would newly connect), and a minimum build length. Routed before/after connectivity gain: not assessed. No routed connectivity model exists in this pipeline, so connectivity before, connectivity after and the residents who would newly gain access are reported as unavailable rather than estimated from the catchment.
This area ranks highly because approximately 65 school features, 9 transport features, 243 workplace features, 255 shop & service features, 278 other mapped features are already mapped within a 2 km cycling catchment of it, and it addresses a 249 m gap in the existing network. Estimated mapped destinations in the 2 km catchment: this corridor's category breakdown is reconciled across overlapping catchments, so the figures are approximate counts of mapped features rather than exact ones.
Overlap-adjusted: 8,234 residents counted for this corridor. 23% of its catchment is already served by a higher-ranked candidate on this shortlist and is not counted twice.
Residents in catchment8,234Health benefit / yearAUD 89,540 – AUD 538,913conservative–ambitious uptakeFuel & running-cost saving / yearAUD 3,659 – AUD 22,022conservative–ambitious uptakeModelled additional cyclists at sustained uptake82 – 494conservative–ambitious uptakeDestinations mapped in catchment850CO₂ saved / year4.0 t – 24.2 tconservative–ambitious uptakeBefore overlap adjustment
Residents in catchment10,728Health benefit / yearAUD 116,661 – AUD 702,144Fuel & running-cost saving / yearAUD 4,767 – AUD 28,693Modelled additional cyclists at sustained uptake107 – 644Destinations mapped in catchment850CO₂ saved / year5.2 t – 31.6 t -
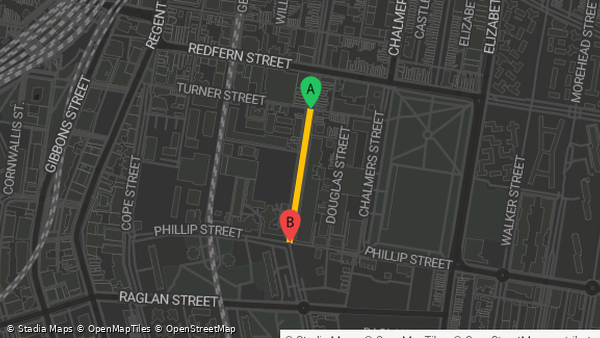 5 Missing link · 258 m
Pitt Street
Locality: Pitt Street
Location -33.89458, 151.20357
Corridor ID f951e8e1-f389-49e1-b9ee-914485564356
✓ Automated screening: passed 5 of 5 checks.
Structural network-gain proxy: the distinct existing ways the build would join, the destinations ALREADY MAPPED inside its catchment (not destinations this build would newly connect), and a minimum build length. Routed before/after connectivity gain: not assessed. No routed connectivity model exists in this pipeline, so connectivity before, connectivity after and the residents who would newly gain access are reported as unavailable rather than estimated from the catchment.
This area ranks highly because approximately 67 school features, 11 transport features, 248 workplace features, 258 shop & service features, 274 other mapped features are already mapped within a 2 km cycling catchment of it, and it addresses a 258 m gap in the existing network. Estimated mapped destinations in the 2 km catchment: this corridor's category breakdown is reconciled across overlapping catchments, so the figures are approximate counts of mapped features rather than exact ones.
Overlap-adjusted: 1,476 residents counted for this corridor. 86% of its catchment is already served by a higher-ranked candidate on this shortlist and is not counted twice.
Residents in catchment1,476Health benefit / yearAUD 16,074 – AUD 96,598conservative–ambitious uptakeFuel & running-cost saving / yearAUD 657 – AUD 3,947conservative–ambitious uptakeModelled additional cyclists at sustained uptake15 – 89conservative–ambitious uptakeDestinations mapped in catchment858CO₂ saved / year723 kg – 4.3 tconservative–ambitious uptakeBefore overlap adjustment
Residents in catchment10,612Health benefit / yearAUD 115,570 – AUD 694,512Fuel & running-cost saving / yearAUD 4,723 – AUD 28,381Modelled additional cyclists at sustained uptake106 – 637Destinations mapped in catchment858CO₂ saved / year5.2 t – 31.2 t -
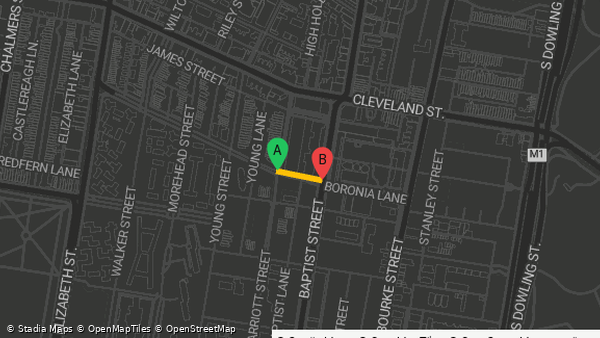 6 Missing link · 89 m
Marriott Street
Locality: Marriott Street
Location -33.89286, 151.21186
Corridor ID b216d944-9290-483a-b7c2-1c6786d97791
✓ Automated screening: passed 5 of 5 checks.
Structural network-gain proxy: the distinct existing ways the build would join, the destinations ALREADY MAPPED inside its catchment (not destinations this build would newly connect), and a minimum build length. Routed before/after connectivity gain: not assessed. No routed connectivity model exists in this pipeline, so connectivity before, connectivity after and the residents who would newly gain access are reported as unavailable rather than estimated from the catchment.
This area ranks highly because approximately 10 school features, 19 workplace features, 51 shop & service features, 71 other mapped features are already mapped within a 2 km cycling catchment of it, and it addresses a 89 m gap in the existing network. Estimated mapped destinations in the 2 km catchment: this corridor's category breakdown is reconciled across overlapping catchments, so the figures are approximate counts of mapped features rather than exact ones.
Overlap-adjusted: 3,369 residents counted for this corridor. 66% of its catchment is already served by a higher-ranked candidate on this shortlist and is not counted twice.
Residents in catchment3,369Health benefit / yearAUD 36,643 – AUD 220,228conservative–ambitious uptakeFuel & running-cost saving / yearAUD 1,497 – AUD 8,999conservative–ambitious uptakeModelled additional cyclists at sustained uptake34 – 202conservative–ambitious uptakeDestinations mapped in catchment151CO₂ saved / year1.6 t – 9.9 tconservative–ambitious uptakeBefore overlap adjustment
Residents in catchment9,924Health benefit / yearAUD 107,938 – AUD 648,720Fuel & running-cost saving / yearAUD 4,411 – AUD 26,509Modelled additional cyclists at sustained uptake99 – 595Destinations mapped in catchment151CO₂ saved / year4.9 t – 29.2 t -
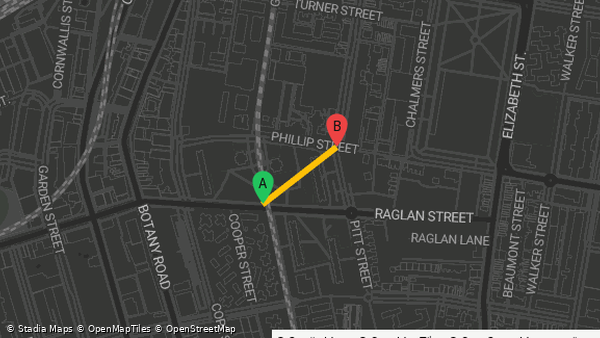 7 Missing link · 280 m
Pitt Street
Locality: Pitt Street
Location -33.89621, 151.20259
Corridor ID d5ea05e5-e2c1-4129-be4a-e273f41e6f2d
✓ Automated screening: passed 5 of 5 checks.
Structural network-gain proxy: the distinct existing ways the build would join, the destinations ALREADY MAPPED inside its catchment (not destinations this build would newly connect), and a minimum build length. Routed before/after connectivity gain: not assessed. No routed connectivity model exists in this pipeline, so connectivity before, connectivity after and the residents who would newly gain access are reported as unavailable rather than estimated from the catchment.
This area ranks highly because approximately 64 school features, 9 transport features, 245 workplace features, 247 shop & service features, 276 other mapped features are already mapped within a 2 km cycling catchment of it, and it addresses a 280 m gap in the existing network. Estimated mapped destinations in the 2 km catchment: this corridor's category breakdown is reconciled across overlapping catchments, so the figures are approximate counts of mapped features rather than exact ones.
Overlap-adjusted: 1,120 residents counted for this corridor. 88% of its catchment is already served by a higher-ranked candidate on this shortlist and is not counted twice.
Residents in catchment1,120Health benefit / yearAUD 12,233 – AUD 73,270conservative–ambitious uptakeFuel & running-cost saving / yearAUD 500 – AUD 2,994conservative–ambitious uptakeModelled additional cyclists at sustained uptake11 – 67conservative–ambitious uptakeDestinations mapped in catchment841CO₂ saved / year550 kg – 3.3 tconservative–ambitious uptakeBefore overlap adjustment
Residents in catchment9,383Health benefit / yearAUD 102,487 – AUD 613,831Fuel & running-cost saving / yearAUD 4,188 – AUD 25,084Modelled additional cyclists at sustained uptake94 – 563Destinations mapped in catchment841CO₂ saved / year4.6 t – 27.6 t -
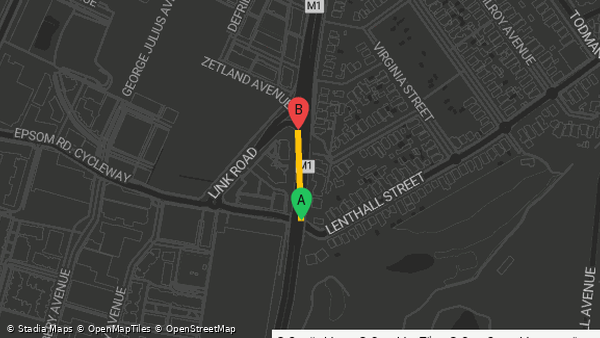 8 Missing link · 172 m
Southern Cross Drive
Locality: Southern Cross Drive
Location -33.91147, 151.21292
Corridor ID 24ec58ce-f7eb-4caa-85b7-dddfaa1e2cce
✓ Automated screening: passed 5 of 5 checks.
Structural network-gain proxy: the distinct existing ways the build would join, the destinations ALREADY MAPPED inside its catchment (not destinations this build would newly connect), and a minimum build length. Routed before/after connectivity gain: not assessed. No routed connectivity model exists in this pipeline, so connectivity before, connectivity after and the residents who would newly gain access are reported as unavailable rather than estimated from the catchment.
This area ranks highly because approximately 18 school features, 32 workplace features, 74 shop & service features, 114 other mapped features are already mapped within a 2 km cycling catchment of it, and it addresses a 172 m gap in the existing network. Estimated mapped destinations in the 2 km catchment: this corridor's category breakdown is reconciled across overlapping catchments, so the figures are approximate counts of mapped features rather than exact ones.
Its most exposed stretch would need about 51 more percentage points of tree canopy to stay usable in extreme heat.
Residents in catchment8,648Health benefit / yearAUD 93,765 – AUD 565,858conservative–ambitious uptakeFuel & running-cost saving / yearAUD 3,832 – AUD 23,123conservative–ambitious uptakeModelled additional cyclists at sustained uptake86 – 519conservative–ambitious uptakeDestinations mapped in catchment238CO₂ saved / year4.2 t – 25.4 tconservative–ambitious uptake -
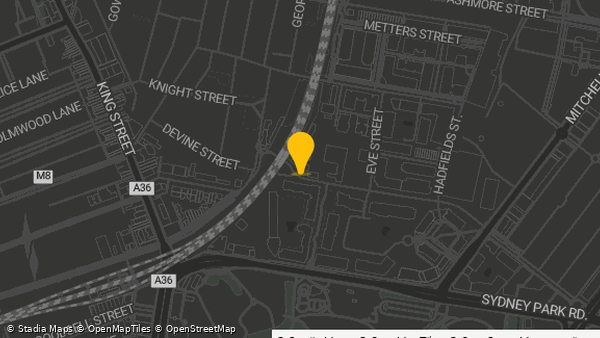 9 Bike lane
Coulson Street
Locality: Coulson Street
Location -33.90553, 151.18424
Corridor ID ded59519-e953-4280-a3eb-533837ecb317
This area ranks highly because 25 school features, 6 transport features, 173 workplace features, 102 shop & service features are already mapped within a 2 km cycling catchment of it, and it addresses a 2.9 km gap in the existing network.
Residents in catchment7,306Health benefit / yearAUD 79,591 – AUD 477,545conservative–ambitious uptakeFuel & running-cost saving / yearAUD 3,252 – AUD 19,514conservative–ambitious uptakeModelled additional cyclists at sustained uptake73 – 438conservative–ambitious uptakeDestinations mapped in catchment444CO₂ saved / year3.6 t – 21.5 tconservative–ambitious uptake -
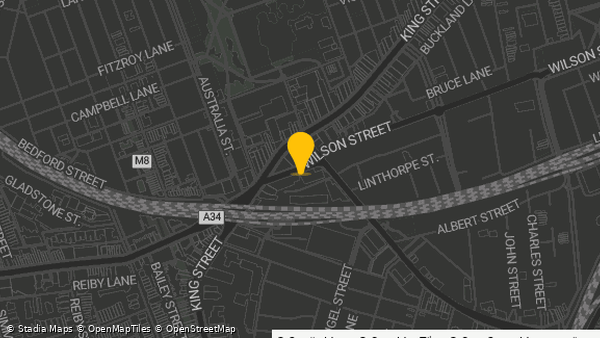 10 Bike lane
Wilson Street
Locality: Wilson Street
Location -33.89715, 151.17997
Corridor ID 332a7150-0eaf-49c9-90d2-8e4b0f58ed75
This area ranks highly because 45 school features, 5 transport features, 127 workplace features, 130 shop & service features are already mapped within a 2 km cycling catchment of it, and it addresses a 2.9 km gap in the existing network.
Residents in catchment6,748Health benefit / yearAUD 73,049 – AUD 441,566conservative–ambitious uptakeFuel & running-cost saving / yearAUD 2,985 – AUD 18,044conservative–ambitious uptakeModelled additional cyclists at sustained uptake67 – 405conservative–ambitious uptakeDestinations mapped in catchment474CO₂ saved / year3.3 t – 19.8 tconservative–ambitious uptake
10 candidate clusters did not pass the automated screen
These clusters did not pass the automated screening checks, so they are not on the shortlist above, carry no modelled benefit and were excluded from its overlap adjustment. They are published here — and in full in the downloadable corridor GeoJSON — so the finding can be checked locally.
-
1. Multi-street corridor — 5 linked gaps (requires validation)
Location -33.88059, 151.20161
Corridor ID 5c8ecd91-b5a6-4987-b7a8-860470cd2c95

Did not pass: not continuous on the ground — the geometry is in several pieces; no plausible set of distinct network edges behind it
Structural network-gain proxy: the distinct existing ways the build would join, the destinations ALREADY MAPPED inside its catchment (not destinations this build would newly connect), and a minimum build length. Routed before/after connectivity gain: not assessed. No routed connectivity model exists in this pipeline, so connectivity before, connectivity after and the residents who would newly gain access are reported as unavailable rather than estimated from the catchment.
This area ranks highly because approximately 77 school features, 40 transport features, 535 workplace features, 411 shop & service features, 357 other mapped features are already mapped within a 2 km cycling catchment of it, and it addresses a 425 m gap in the existing network. Estimated mapped destinations in the 2 km catchment: this corridor's category breakdown is reconciled across overlapping catchments, so the figures are approximate counts of mapped features rather than exact ones.
-
2. Multi-street corridor — 7 linked gaps (requires validation)
Location -33.90133, 151.21069
Corridor ID 909190e1-602a-41e4-9e78-08bbeca47ca3
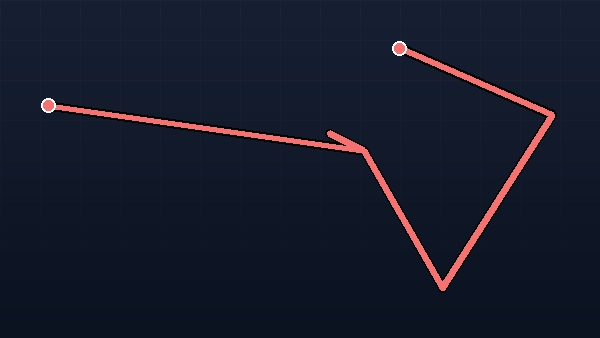
Did not pass: not continuous on the ground — the geometry is in several pieces; no plausible set of distinct network edges behind it
Structural network-gain proxy: the distinct existing ways the build would join, the destinations ALREADY MAPPED inside its catchment (not destinations this build would newly connect), and a minimum build length. Routed before/after connectivity gain: not assessed. No routed connectivity model exists in this pipeline, so connectivity before, connectivity after and the residents who would newly gain access are reported as unavailable rather than estimated from the catchment.
This area ranks highly because approximately 50 school features, 1 transport feature, 226 workplace features, 188 shop & service features, 251 other mapped features are already mapped within a 2 km cycling catchment of it, and it addresses a 499 m gap in the existing network. Estimated mapped destinations in the 2 km catchment: this corridor's category breakdown is reconciled across overlapping catchments, so the figures are approximate counts of mapped features rather than exact ones.
-
3. Multi-street corridor — 5 linked gaps (requires validation)
Location -33.87739, 151.20106
Corridor ID 27fc5ae1-c2b4-4330-8e93-1324cc9be543

Did not pass: not continuous on the ground — the geometry is in several pieces; no plausible set of distinct network edges behind it; calculated, member and drawn lengths do not reconcile
Structural network-gain proxy: the distinct existing ways the build would join, the destinations ALREADY MAPPED inside its catchment (not destinations this build would newly connect), and a minimum build length. Routed before/after connectivity gain: not assessed. No routed connectivity model exists in this pipeline, so connectivity before, connectivity after and the residents who would newly gain access are reported as unavailable rather than estimated from the catchment.
This area ranks highly because approximately 78 school features, 53 transport features, 554 workplace features, 414 shop & service features, 343 other mapped features are already mapped within a 2 km cycling catchment of it, and it addresses a 926 m gap in the existing network. Estimated mapped destinations in the 2 km catchment: this corridor's category breakdown is reconciled across overlapping catchments, so the figures are approximate counts of mapped features rather than exact ones.
-
4. Multi-street corridor — 11 linked gaps (requires validation)
Location -33.88061, 151.19842
Corridor ID 2ef523b5-a4db-41cf-8b2a-f8d36d16523b
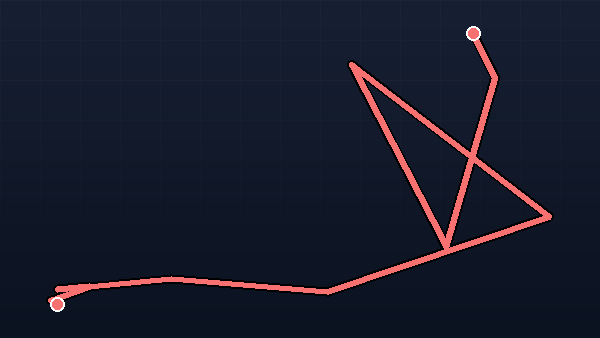
Did not pass: not continuous on the ground — the geometry is in several pieces; no plausible set of distinct network edges behind it
Structural network-gain proxy: the distinct existing ways the build would join, the destinations ALREADY MAPPED inside its catchment (not destinations this build would newly connect), and a minimum build length. Routed before/after connectivity gain: not assessed. No routed connectivity model exists in this pipeline, so connectivity before, connectivity after and the residents who would newly gain access are reported as unavailable rather than estimated from the catchment.
This area ranks highly because approximately 77 school features, 42 transport features, 517 workplace features, 403 shop & service features, 389 other mapped features are already mapped within a 2 km cycling catchment of it, and it addresses a 275 m gap in the existing network. Estimated mapped destinations in the 2 km catchment: this corridor's category breakdown is reconciled across overlapping catchments, so the figures are approximate counts of mapped features rather than exact ones.
-
5. Multi-street corridor — 7 linked gaps (requires validation)
Location -33.87943, 151.20178
Corridor ID 6c10dd01-68ea-4262-a48f-da118555380a
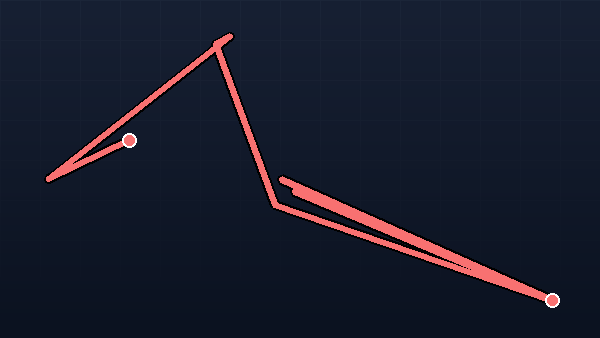
Did not pass: not continuous on the ground — the geometry is in several pieces; no plausible set of distinct network edges behind it; calculated, member and drawn lengths do not reconcile
Structural network-gain proxy: the distinct existing ways the build would join, the destinations ALREADY MAPPED inside its catchment (not destinations this build would newly connect), and a minimum build length. Routed before/after connectivity gain: not assessed. No routed connectivity model exists in this pipeline, so connectivity before, connectivity after and the residents who would newly gain access are reported as unavailable rather than estimated from the catchment.
This area ranks highly because approximately 76 school features, 41 transport features, 547 workplace features, 412 shop & service features, 333 other mapped features are already mapped within a 2 km cycling catchment of it, and it addresses a 451 m gap in the existing network. Estimated mapped destinations in the 2 km catchment: this corridor's category breakdown is reconciled across overlapping catchments, so the figures are approximate counts of mapped features rather than exact ones.
-
6. Multi-street corridor — 3 linked gaps (requires validation)
Location -33.87818, 151.19578
Corridor ID 28e870a5-a0a7-4eab-8254-61f8570b07e5

Did not pass: not continuous on the ground — the geometry is in several pieces; no plausible set of distinct network edges behind it
Structural network-gain proxy: the distinct existing ways the build would join, the destinations ALREADY MAPPED inside its catchment (not destinations this build would newly connect), and a minimum build length. Routed before/after connectivity gain: not assessed. No routed connectivity model exists in this pipeline, so connectivity before, connectivity after and the residents who would newly gain access are reported as unavailable rather than estimated from the catchment.
This area ranks highly because approximately 30 school features, 14 transport features, 66 workplace features, 89 shop & service features, 99 other mapped features are already mapped within a 2 km cycling catchment of it, and it addresses a 823 m gap in the existing network. Estimated mapped destinations in the 2 km catchment: this corridor's category breakdown is reconciled across overlapping catchments, so the figures are approximate counts of mapped features rather than exact ones.
-
7. Multi-street corridor — 5 linked gaps (requires validation)
Location -33.87443, 151.20051
Corridor ID e6c809cc-a958-42eb-a205-b41787c3e831

Did not pass: not continuous on the ground — the geometry is in several pieces; no plausible set of distinct network edges behind it
Structural network-gain proxy: the distinct existing ways the build would join, the destinations ALREADY MAPPED inside its catchment (not destinations this build would newly connect), and a minimum build length. Routed before/after connectivity gain: not assessed. No routed connectivity model exists in this pipeline, so connectivity before, connectivity after and the residents who would newly gain access are reported as unavailable rather than estimated from the catchment.
This area ranks highly because approximately 75 school features, 56 transport features, 551 workplace features, 380 shop & service features, 330 other mapped features are already mapped within a 2 km cycling catchment of it, and it addresses a 247 m gap in the existing network. Estimated mapped destinations in the 2 km catchment: this corridor's category breakdown is reconciled across overlapping catchments, so the figures are approximate counts of mapped features rather than exact ones.
-
8. Multi-street corridor — 5 linked gaps (requires validation)
Location -33.87856, 151.21631
Corridor ID 4a0bb336-f3e2-4707-8590-dbd6af2852b0
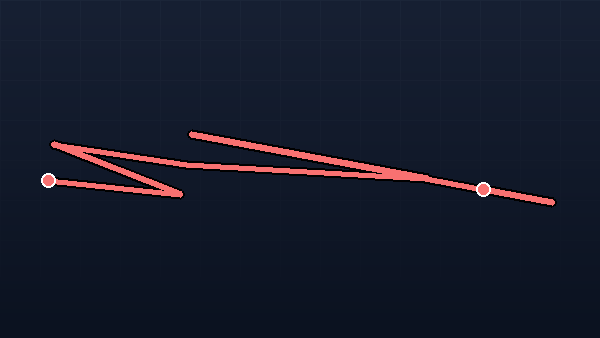
Did not pass: not continuous on the ground — the geometry is in several pieces; no plausible set of distinct network edges behind it
Structural network-gain proxy: the distinct existing ways the build would join, the destinations ALREADY MAPPED inside its catchment (not destinations this build would newly connect), and a minimum build length. Routed before/after connectivity gain: not assessed. No routed connectivity model exists in this pipeline, so connectivity before, connectivity after and the residents who would newly gain access are reported as unavailable rather than estimated from the catchment.
This area ranks highly because approximately 69 school features, 29 transport features, 489 workplace features, 413 shop & service features, 317 other mapped features are already mapped within a 2 km cycling catchment of it, and it addresses a 194 m gap in the existing network. Estimated mapped destinations in the 2 km catchment: this corridor's category breakdown is reconciled across overlapping catchments, so the figures are approximate counts of mapped features rather than exact ones.
-
9. Multi-street corridor — 4 linked gaps (requires validation)
Location -33.87430, 151.20387
Corridor ID 3ef685e4-4c89-4d6c-967c-ed034345f096

Did not pass: not continuous on the ground — the geometry is in several pieces; no plausible set of distinct network edges behind it
Structural network-gain proxy: the distinct existing ways the build would join, the destinations ALREADY MAPPED inside its catchment (not destinations this build would newly connect), and a minimum build length. Routed before/after connectivity gain: not assessed. No routed connectivity model exists in this pipeline, so connectivity before, connectivity after and the residents who would newly gain access are reported as unavailable rather than estimated from the catchment.
This area ranks highly because approximately 73 school features, 55 transport features, 556 workplace features, 408 shop & service features, 332 other mapped features are already mapped within a 2 km cycling catchment of it, and it addresses a 350 m gap in the existing network. Estimated mapped destinations in the 2 km catchment: this corridor's category breakdown is reconciled across overlapping catchments, so the figures are approximate counts of mapped features rather than exact ones.
-
10. Multi-street corridor — 2 linked gaps (requires validation)
Location -33.87575, 151.20390
Corridor ID fdba7a3b-0453-412b-8b46-c1aaab28b9f2
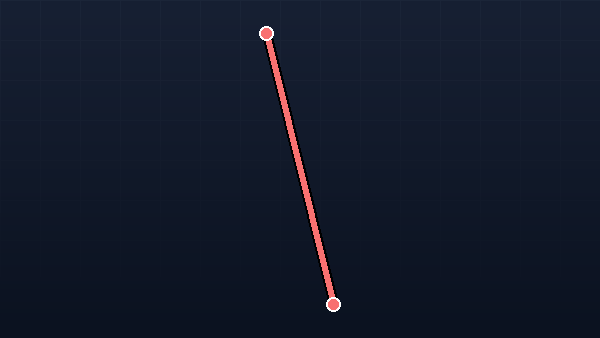
Did not pass: no plausible set of distinct network edges behind it; the structural network-gain proxy is not met
Structural network-gain proxy: the distinct existing ways the build would join, the destinations ALREADY MAPPED inside its catchment (not destinations this build would newly connect), and a minimum build length. Routed before/after connectivity gain: not assessed. No routed connectivity model exists in this pipeline, so connectivity before, connectivity after and the residents who would newly gain access are reported as unavailable rather than estimated from the catchment.
This area ranks highly because approximately 75 school features, 53 transport features, 558 workplace features, 424 shop & service features, 315 other mapped features are already mapped within a 2 km cycling catchment of it, and it addresses a 95 m gap in the existing network. Estimated mapped destinations in the 2 km catchment: this corridor's category breakdown is reconciled across overlapping catchments, so the figures are approximate counts of mapped features rather than exact ones.
Modelling assumptions
- Uptake — conservative
- 1%
- Uptake — ambitious
- 6%
- Trips per new cyclist
- 3 / week
- Average trip distance
- 4 km
- Car trips replaced
- 40%
- Benefit basis
- Annual, steady-state (per year once uptake is sustained; no multi-year ramp modelled)
- Modelled additional cyclists
- A steady-state stock at sustained uptake, not an annual intake; mode-shift of catchment residents, with existing cyclists not separately excluded. Each corridor publishes the population its riders were modelled on, its corridor adjustment factor and the final effective uptake rate that implies
- Catchment & overlap
- Residents within the corridor buffer (WorldPop); portfolio counts each resident once (a corridor's buffer minus the union of higher-ranked corridors' buffers)
- Crashes & air pollution
- Not separately assessed
- Currency & valuation year
- AUD, 2026 prices — local currency, not converted; cross-city monetary comparisons are indicative only
- Value of statistical life
- AUD 5,300,000
- All-cause mortality rate
- 400 per 100,000/yr
- HEAT reference dose
- 100 min/week (~1213 km/yr)
- Mortality reduction at reference dose
- 10%
- Serious injury cost
- AUD 260,000
- Discount rate
- 5%
- Appraisal horizon
- 10 years
- Casualty reduction from facility
- 30%
- Protected-lane build cost
- AUD 250,000/km
- Social cost of carbon
- AUD 75/tonne
- Value of time
- AUD 40/hr × 50%
- Time saved per trip
- 2 min
- Fuel levy
- AUD 0.50/L
- Consumption tax (VAT/GST)
- 10%
Local data that would validate this 0 / 7
This scorecard is built entirely from open data, scored the same way worldwide. A handful of local datasets would turn it into a validated, city-specific diagnostic — and then a measured pilot.
Open-data baseline
this scorecard, today.Locally-validated diagnostic
your datasets below, reconciled against ours.Measured pilot
counts and outcomes tracked on the ground.-
Official cycling-network GIS Needed
Your authoritative lane/path layer, to reconcile against the OSM-derived network.
Validates: Coverage & comfort classification
-
Census cycling mode share Needed
Journey-to-work (or all-trip) cycling share, as an external outcome to compare the index against.
Validates: External outcome comparison
-
Cycling counts Needed
Automatic or manual count-site volumes, to switch on a measured ridership layer.
Validates: Ridership (activation layer)
-
Crash / casualty records Needed
Geocoded cycling crashes, to switch on a measured safety layer and target corridors.
Validates: Safety (activation layer)
-
Traffic speeds & volumes Needed
Road speeds/volumes, to refine which streets count as low-stress for the network graph.
Validates: Comfort / traffic-stress classification
-
Planned / funded projects Needed
Your committed pipeline, so proposed corridors are de-duplicated against what's already funded.
Validates: Priority corridors
-
Local demographic / equity data Needed
Local equity indicators, to weight access by who is currently underserved.
Validates: Access equity overlay
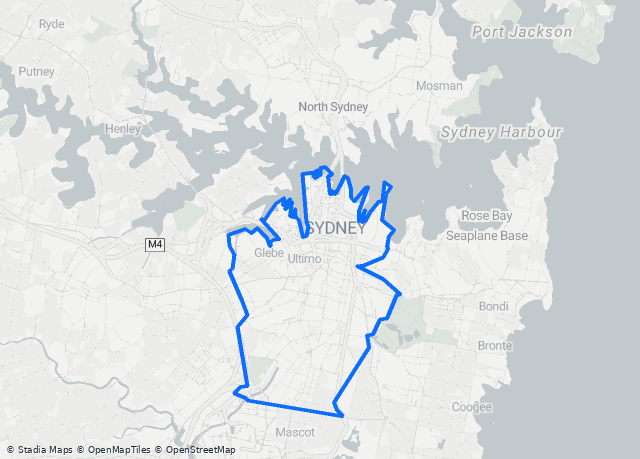
What “City of Sydney” means on this scorecard
Every calculation is clipped to the exact study extent shown here — no cherry-picked study areas. Where that extent came from is named below.
- Boundary source
- geoBoundaries administrative footprint
- Administrative level
- City / Council
- Boundary type
- Municipality
- Study boundary ID
- 25037944B98854570895907
- Enclosed area
- 27 km²
- Built-up area (density denominator)
- 27 km²
- Population density
- 8446 residents/km²
The scored polygon IS one published administrative feature, cited by its own geoBoundaries shapeID, so its identity rests on that citation rather than on a measurement against a municipal-tier feature.
How hilly is the network?
Average network grade 2.0%, with 8.5% of the network on slopes above 5%. Contextual — terrain does not change the index score. © Commonwealth of Australia (Geoscience Australia) (CC BY 4.0) © Commonwealth of Australia (Geoscience Australia) (CC BY 4.0) © Commonwealth of Australia (Geoscience Australia) (CC BY 4.0) © Commonwealth of Australia (Geoscience Australia) (CC BY 4.0)
What do we know about this network after dark?
34.1% of the cycling network has confirmed or inferred nighttime illumination. For 57.7% the evidence is inconclusive, and for 8.2% there is none either way. Contextual — nighttime illumination is shown as evidence and does not change the index score. It becomes a scored dimension when a city supplies its street-lighting asset register.
Nighttime satellite radiance indicates artificial illumination in the surrounding area. It does not necessarily mean that dedicated street lighting is present on the road itself.
Satellite evidence was gathered but is not yet calibrated for this city, so it is recorded without drawing a conclusion. Confirmed shares come from OpenStreetMap lighting tags and mapped lamp posts.
Can this network be used in extreme heat?
76.9% of the residents who can reach a bike route today can still reach one that stays usable in the heat. Measured across 92.1% of the qualifying network. Contextual — heat resilience does not change the index score.
Tree canopy here is checked against New South Wales's 2022 Greater Sydney canopy survey. Along streets — the blocks with scattered trees rather than parkland — the two agree to within about 2 percentage points.
What sits behind the number
Sub-scores & evidenceEvery dimension shows exactly how it's measured and the single lever that would move it. Nothing hidden. Want the thresholds themselves? Read the full scoring methodology — what each score means, how every dimension is measured, and what the index does not claim.
22 km physically protected · 78 km shared path · 13 km painted · 11 km mixed traffic — 123 km modelled → 75 effective km ≈ 2.82 km/km² built-up (quality-weighted)
Lever to improveBuild protected lanes / paths
77% of the low-stress network is one connected piece · 1,470 candidate network discontinuities detected before screening
Lever to improveClose the highest-severity missing links
94% of residents within 300 m of traffic-free cycling infrastructure — an off-street path or a physically protected lane, ITDP's People Near Protected Bikelanes definition · the traffic-free network behind it is 22 km separated cycleway and 78 km path shared with pedestrians (78% shared)
Lever to improveFill accessibility-lane gaps where people live
1,107 parking · 8 repair · 364 water · 246 toilets ≈ 16.52 capped weighted units per km² of built-up area · 90.0 parking per 10 km of network
Lever to improveAdd parking / repair / water at hubs
Network composition
What the modelled total containsNetwork comfort mix
Classified by separationComparable on-street lane network: 34 km of separated + painted lanes — the like-for-like figure to set beside your city's own lane count. The full 123 km above additionally counts shared and off-road paths, so it reads higher.
Corridor kilometres. Network length is measured in CORRIDOR kilometres: each physical corridor counts once. A street with a cycle track on each side is two usable facilities but one corridor, and OpenStreetMap records that either as one carriageway or as two parallel ways — counting rows would make the figure depend on local mapping habit. Ways running parallel within 4–25 m of each other are treated as one corridor. That removed 13.8% of this city's as-mapped length.
Data & assumptions
Nothing hiddenEvery source, version and economic assumption behind this scorecard — and the raw figures to download and check yourself.
OpenStreetMap (infrastructure)
- Extract
- Not recorded on this snapshot
- Extract published
- Not recorded on this snapshot
- Artifact built
- Not recorded on this snapshot
- Build run
- Not recorded on this snapshot
- Extract loaded
- 2026-11-06
- Source
- Not recorded on this snapshot
- Query area
- geoBoundaries administrative footprint
- Facility classifier version
- Not recorded on this snapshot
- Methodology version
- v19
- Licence
- ODbL — © OpenStreetMap contributors
- Why fields are blank
- Several loads of this dataset exist in this deployment and this city has no load of its own, so the specific one behind these figures cannot be identified. Re-provision the city to record it.
WorldPop (population)
- Product
- aus_pop_2024_CN_100m_R2025A_v1
- Edition / year
- 2024
- Release
- R2025A
- Modelling basis
- Constrained (residents placed only on built-up settlements)
- Adjustment
- Unadjusted (the product's own modelled totals)
- Source
- https://data.worldpop.org/GIS/Population/Global_2015_2030/R2025A/2024/AUS/v1/100m/constrained/aus_pop_2024_CN_100m_R2025A_v1.tif
- Layer identifier (internal)
- worldpop_city-of-sydney @ 100 m
- Layer selection
- The load built for this city — the only one counted.
- Layer synced
- 2026-08-02
- Resolution
- 100 m
- Licence
- CC BY 4.0 — © WorldPop (worldpop.org)
Road lighting (nighttime illumination evidence)
- Radiance product
- VNL_npp_2025_global_vcmslcfg_v2_median_cog
- Composite year
- 2025
- Layer identifier (internal)
- viirs_glen-eira
- Layer loaded
- 2026-09-05
- Nominal resolution
- 463 m per pixel — coarser than any single street
- Street lamps (OpenStreetMap)
- 127 mapped lamp nodes in the study area
- Satellite calibration
- Not calibrated — radiance is recorded as evidence but states no direction. Confirmed shares rest on OpenStreetMap lighting tags and mapped lamp posts.
- Used for
- A contextual view of what is known about the network after dark. It is an activation-layer dimension: displayed, never scored, and it changes no part of the Infrastructure Provision result.
- Lighting model version
- v2
- Licence
- Radiance: CC BY 4.0 — © Earth Observation Group, Payne Institute for Public Policy, Colorado School of Mines · Lighting tags and lamp nodes: ODbL — © OpenStreetMap contributors
geoBoundaries (the scored boundary IS this published feature)
- Boundary source
- geoBoundaries administrative footprint
- Administrative level
- City / Council
- Country (ISO3)
- AUS
- Release
- geoBoundaries (synced 2026-07-07)
- Licence
- CC BY 4.0 — © geoBoundaries
Methodology
- Version
- v19
- Infrastructure Provision
- The four infrastructure dimensions, renormalised to 100. Ridership & Safety are reported separately (activation layer) and do not change the infrastructure result.
- Dimension weights
- access=0.27223 · safety=0.1 · coverage=0.19446 · amenities=0 · ridership=0.1 · connectivity=0.23331 · intersection_delay=0.1
- Provision thresholds (basic / strong / leading)
- Coverage 1 / 2.5 / 5 · Access 50 / 80 / 100 · Amenities 2 / 10 / 40. These are FIXED provision criteria, not positions among other cities: 50 means basic but incomplete provision, 80 strong citywide provision, and 100 near-complete performance, interpolated in between. They do not change as cities are added to the board, so a city's score moves only when its own infrastructure or data does. Connected network share — identity scale, no threshold set: the percentage IS the score, so 62% of the network in one connected component scores 62. No published source states a normative target for this measure, and borrowing one written for a different measure would claim more than the evidence supports.
- Contextual reference (not scored)
- gap density 0.59 gaps/network-km (a diagnostic shown when connectivity abstains) · safety failure threshold 20 events/100k km (activation layer)
- Scoring
- Higher-is-better dimensions (coverage, access, amenities) are interpolated along fixed provision thresholds: 0 at zero, 50 at basic provision, 80 at strong, 100 at leading, straight lines between, clamped at each end. Access and Connectivity are already percentages, so their score IS the percentage. Gap density is contextual, not scored (v13). Safety, if scored, is lower-is-better against a FAILURE THRESHOLD: 100 - min(100, rate / threshold x 100), so zero events scores 100 and a rate at or above the threshold scores zero. See the calculation trace below.
Where the scoring targets come from
- Coverage target
- Percentile-derived, computed by us: the 90th percentile of the 40 cities on Party Onbici's own board with a population of 100,000 or more that held a snapshot on 2026-07-06, using the read-only calibrate_index_targets command. It is not a policy target and no standards body set it.
- Access target
- Percentile-derived, computed by us: the 90th percentile of the same 40-city board on 2026-07-06. What is measured — residents within 300 m of traffic-free infrastructure, an off-street path or a physically protected lane — follows ITDP's People Near Protected Bikelanes definition, but the level at which it scores 100 is ours, not ITDP's: ITDP publishes no such threshold.
- Amenities target
- Percentile-derived, computed by us: the 90th percentile of the same 40-city board on 2026-07-06. The per-category weights that turn facilities into units (parking 1.0 · repair station 4.0 · drinking water 2.0 · public toilet 0.5) are internally selected reference values — our own judgement of what each is worth to a rider, not calibrated and not taken from a published source.
- Gap-density reference
- Percentile-derived, computed by us: the 10th percentile of the same 40-city board on 2026-07-06 — the opposite tail, because fewer gaps is better. Contextual only since methodology v13: it is shown when connectivity abstains and scores nothing.
- Ridership and safety
- Internally selected reference values, not calibrated against any cohort and not taken from a published source — they were chosen to give the activation layer a scale. That layer is not yet assessed for any city, so neither value affects any published score.
- The cohort itself
- The cohort is the set of cities this platform had already assessed — a convenience sample of our own coverage, not a probability sample, not an international register, and not endorsed by any standards body. Its membership was not recorded at the time; only its size (40 cities) and the population floor (100,000) are on record. A target derived this way says 'the highest level we have measured', not 'the level a city ought to reach'.
Where the economic parameters come from
- Economics basis
- AUS — National appraisal guidance
- Economic parameters
- The economic parameters behind this city's monetary figures come from its own country's official appraisal guidance.
- Inputs we chose ourselves
- These economic inputs trace to no published document — they are our own reference values, not citations: Fleet fuel consumption, Retail petrol price, Fuel excise, Adult all-cause mortality rate, Gross hourly wage, Protected-lane build cost per km, Carbon price per tonne.
How each score is calculated
- Coverage
- 21.6·1.0 + 12.7·0.5 + 88.7·0.8 = 98.9 effective km ÷ 26.6 km² = 3.71/km² → against fixed thresholds 1 (basic) / 2.5 (strong) / 5 (leading) → 83
- Access
- 94% of residents near traffic-free infra against fixed thresholds 0.5 (basic) / 0.8 (strong) / 1 (leading) → 95
- Connected network share
- 77% of low-stress network in its largest component ×100 → 77
- Amenities
- capped weighted units 440.0 ÷ 26.6 km² = 16.52/km² → against fixed thresholds 2 (basic) / 10 (strong) / 40 (leading) → 100 (each category capped at 50% of target)
WHO HEAT scenario inputs
- Value of statistical life
- AUD 5,300,000
- All-cause mortality rate
- 400 per 100,000/yr
- HEAT reference dose
- 100 min/week (~1213 km/yr)
- Mortality reduction at reference dose
- 10%
Party Onbici transport & cost assumptions
- Uptake — conservative
- 1%
- Uptake — ambitious
- 6%
- Trips per new cyclist
- 3 / week
- Average trip distance
- 4 km
- Car trips replaced
- 40%
- Benefit basis
- Annual, steady-state (per year once uptake is sustained; no multi-year ramp modelled)
- Modelled additional cyclists
- A steady-state stock at sustained uptake, not an annual intake; mode-shift of catchment residents, with existing cyclists not separately excluded. Each corridor publishes the population its riders were modelled on, its corridor adjustment factor and the final effective uptake rate that implies
- Catchment & overlap
- Residents within the corridor buffer (WorldPop); portfolio counts each resident once (a corridor's buffer minus the union of higher-ranked corridors' buffers)
- Crashes & air pollution
- Not separately assessed
- Currency & valuation year
- AUD, 2026 prices — local currency, not converted; cross-city monetary comparisons are indicative only
- Serious injury cost
- AUD 260,000
- Discount rate
- 5%
- Appraisal horizon
- 10 years
- Casualty reduction from facility
- 30%
- Protected-lane build cost
- AUD 250,000/km
- Social cost of carbon
- AUD 75/tonne
- Value of time
- AUD 40/hr × 50%
- Time saved per trip
- 2 min
- Fuel levy
- AUD 0.50/L
- Consumption tax (VAT/GST)
- 10%
This report
- Generated
- 2026-11-06 20:20 UTC
- Methodology version
- v19
- Analysis run
- b6ac5d62-5c09-470a-b5b4-f1836d3fe69c
- Code revision
- b80b800a4512c029739bbd55352d626cb510adee
- Scoring config digest
- 1949a2fcba81cfcc
- Software
- Party Onbici City Cycling Index
What transport teams ask us first
Something else on your mind? Bring it to the briefing — or email hello@partyonbici.com.
Put your city's cycling readiness on the record
Book a 30-minute briefing and we'll walk your team through this scorecard, then stand up a live index for your own boundary — same method, same open data, comparable worldwide.
- A live scorecard for your admin boundary, refreshed weekly
- Impact-ranked corridors mapped to your network gaps
- Versioned, documented methodology you can reproduce
Book a briefing
Free · 30 minutes · no procurement required
- We score your boundary from open data
- You get a live scorecard like this one
- You brief your council with the numbers
Prefer email? hello@partyonbici.com
Methodology v19 — versioned and documented targets and weights. Scores are 0–100 against targets Party Onbici sets and accounts for in "Where the scoring targets come from" under Data & assumptions; they are not policy standards set by anyone else. Each composite blends available sub-scores, renormalising weights so excluded dimensions don't distort the total. Area and network length are clipped to this city's study extent, named in the study-area panel. Network length is OSM-classified route-kilometres (separated + painted + shared paths) and may exceed a city's own lane-only total, which typically counts painted and separated lanes only.
Boundaries © geoBoundaries (CC BY 4.0) · infrastructure © OpenStreetMap contributors · population: WorldPop. · This scorecard is a planning diagnostic, not a definitive city ranking. · Party Onbici · shared scorecard
Heat evidence: © Meta and World Resources Institute (CC BY 4.0) · Building footprints © Microsoft, CDLA-Permissive-2.0